

Compound’s New Token Tops DeFi Rankings on First Day
June 17, 2020
Bitcoin Mining Heats Up: High Difficulty Adjustment, Pool Consolidation, Less Concentration in China
June 18, 2020
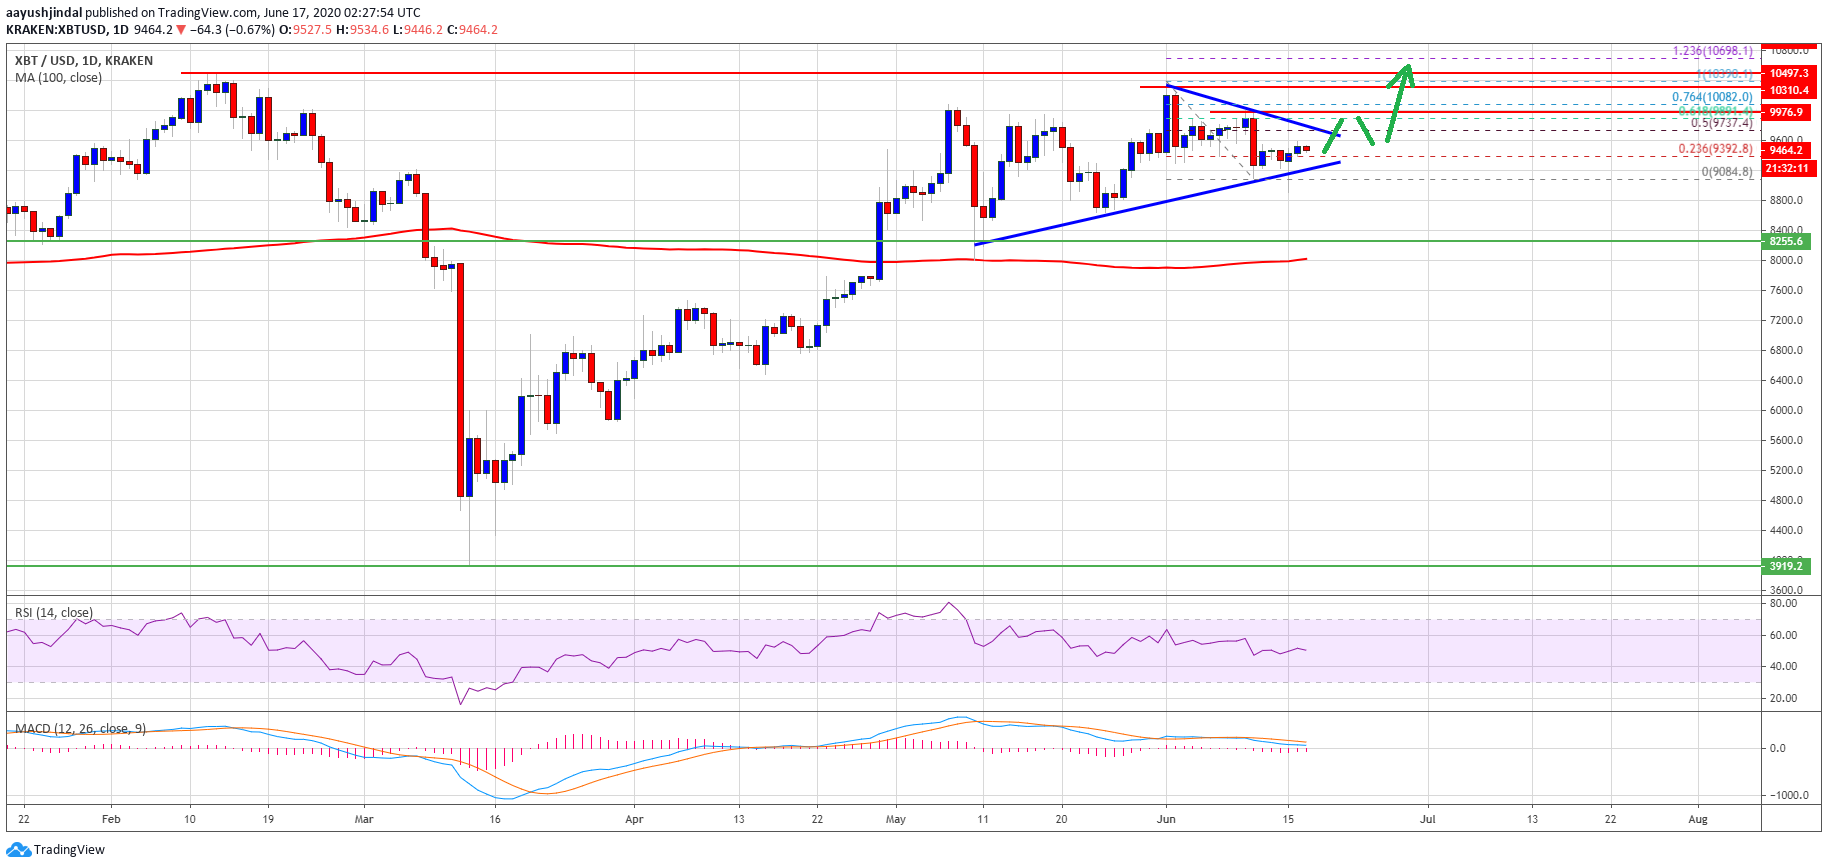
Bitcoin is trading well above key supports on the daily chart against the US Dollar. BTC seems to be preparing for a crucial bullish breakout above the $10,000 resistance zone.
- Bitcoin traded as high as $10,390 before it started a minor downside correction.
- The price is currently trading well above the $9,000 support and the 100-day simple moving average.
- There is a crucial contracting triangle forming with resistance near $9,750 on the daily chart of the BTC/USD pair (data feed from Kraken).
- The pair must break the $9,750 and $10,000 resistance levels to start another increase.
Bitcoin Could Surge Again
Earlier this month, bitcoin price extended its rise above the $10,000 level against the US Dollar. BTC price traded to a new 3-month high at $10,390 and settled well above the 100-day simple moving average.
Recently, there was a downside correction below the $10,000 level. The price broke the $9,500 and $9,300 support levels. However, the price remained well bid near the $9,000 support zone.
Bitcoin is currently recovering and trading well above the $9,300 level. There was a break above the 23.6% Fib retracement level of the downside correction from the $10,390 high to $9,080 swing low.
It seems like there is a crucial contracting triangle forming with resistance near $9,750 on the daily chart of the BTC/USD pair. The triangle resistance is close to the 50% Fib retracement level of the downside correction from the $10,390 high to $9,080 swing low.
Therefore, the price must surpass the $9,750 resistance zone to initiate a fresh increase. The main hurdle is still near the $10,000 level, above which there are high chances of a steady rise towards the $10,500 and $10,800 levels in the near term.
Chances of Bearish Break
If bitcoin struggles to clear the $9,750 resistance, there is a risk of a bearish break. The triangle support is near the $9,300 level. If there is a break and close below $9,300, the price could start a fresh decline.
The first key support is near the $9,000 level, below which the price might extend its decline. The main uptrend support is seen near the $8,250 level and the 100-day simple moving average, where the bulls are likely to take a stand.
Technical indicators:
Daily MACD – The MACD is slowly moving in the bearish zone.
Daily RSI (Relative Strength Index) – The RSI for BTC/USD is just below the 50 level.
Major Support Levels – $9,300 followed by $9,000.
Major Resistance Levels – $9,750, $10,000 and $10,400.


