

Close to 14,000 Google Scholar Articles Mentioned Bitcoin in 2019
December 25, 2019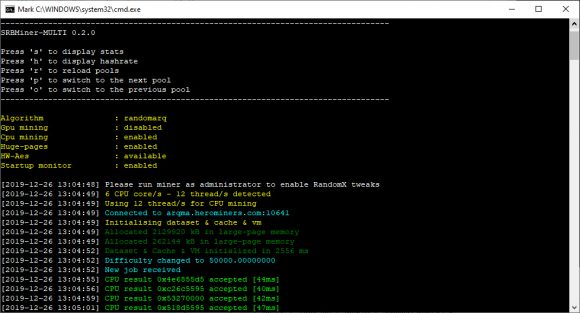
New SRBMiner-MULTI Miner 0.2.0 Beta With Support for New Algorithms
December 26, 2019
Since Bitcoin (BTC) bounced cleanly off the macro $6,400 support earlier this month, analysts have been wondering if the pain is over for the cryptocurrency market. According to two key trend indicators, which predicted previous bear markets and bull markets, the medium-term to long-term trend remains bearish, unfortunately enough.
Related Reading: CME Futures Data: Institutions Still Wary Despite Bitcoin’s Bullish Signs
Why Bitcoin Isn’t In the Clear Yet
Analyst CryptoThies recently noted that despite the strong nearly 15% recovery from the depths of $6,400, his indicator, dubbed MarketGod, is still printing a “sell” signal on the December candle.
He notes that MarketGod has called these macro trends 4/4 in the past six years of Bitcoin price’s history, making the latest “sell” signal rather potent, for it implies that there are months more downside ahead.
Indeed, the last time a “sell” signal was printed by the MarketGod indicator on a monthly timeframe was in the middle of 2018, prior to the 50% capitulation event that took BTC to $3,000 by the end of last year.
Loads of questions in DMs in terms of where I stand on sentiment and current state of the macro trend for #BTC.
Not to be the bearer of bad news, but realistically speaking, I need compelling evidence to overturn MG on a high TF like this, when it’s 4/4 on trend signals. pic.twitter.com/RGOru5cyZw— CryptoThies 📈 (@KingThies) December 24, 2019
It isn’t only Thies’ MarketGod indicator that is flashing harrowing signs on a longer-term basis.
Per NewsBTC’s analysis of the one-month Bitcoin chart, the default settings Moving Average Convergence Divergence (MACD) — a much-used trend following indicator used to determine directionality in markets — recently crossed bearish, with the blue (MACD) line crossing below the orange (signal) line.
This bearish crossover was last seen in June/July of 2018, preceding and predicting the abovementioned 50% decline seen at the end of last year.
Considering the historical trends surrounding the one-month MACD and Bitcoin’s price, there’s a likelihood that the leading cryptocurrency could continue to trend lower in the coming months.
Related Reading: Outrage Grows on Twitter as Youtube Continues to Flag Colossal Crypto Channels
Bull Case Starting to Grow
Sure, these signs exist, though there the bullish Bitcoin case is starting to grow as I write this.
Analyst Mexbt, for instance, recently remarked that “there is a very high chance that the Bitcoin bottom is in,” drawing attention to the below chart, which shows that BTC’s chart has posted strong rebounds after interacting with the key historical horizontal support of $6,400. This, some analysts would say, marks a swing failure pattern that should favor bulls on a longer-term time frame.
I think there is a very high chance that the Bitcoin bottom is in. pic.twitter.com/478nKFcbfl
— mexbt (@stackxbt) December 24, 2019
Also on the technical side of things, prominent trader Scott “The Wolf of All Streets” Melker recently observed that Bitcoin’s price action last week created a “massive bullish divergence in oversold territory on Stochastic Relative Strength Index.”
This is notable as this same signal was seen preceding a bear market rally from $6,400 to $9,900 in mid-2018, the 330% jump in the Bitcoin price seen from December 2018 to June 2019, and the $7,400 and $10,400 jump that took place just weeks ago.
Related Reading: Bitcoin Price Likely to Jump After Christmas; Here’s Why
Featured Image from Shutterstock


