
Bitcoin Makes Another Attempt At $28,000, Can Break Happen?
October 9, 2023
Binance freezes Hamas-linked accounts after Israeli request
October 10, 2023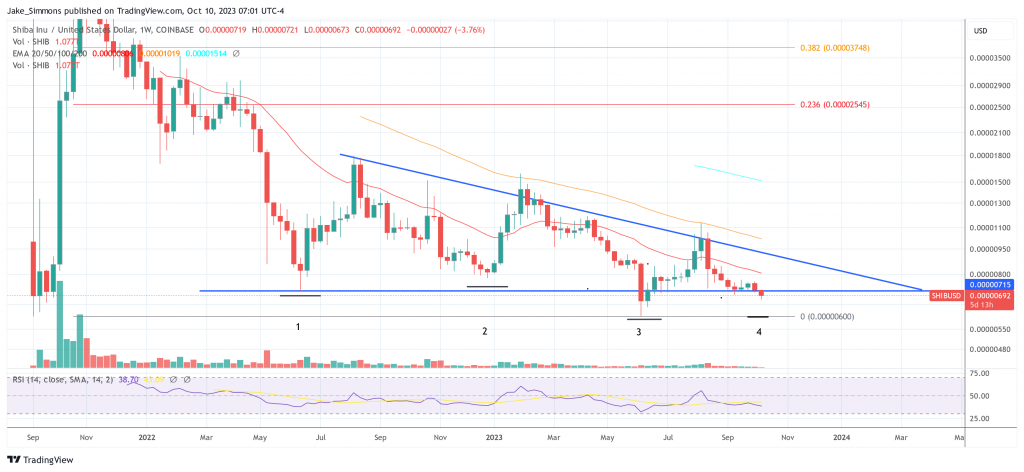
The Shiba Inu (SHIB) price currently treads on crucial technical terrains. As highlighted in previous comprehensive analysis, the potential impacts of two distinct chart patterns were observed on the 1-week timeframe for SHIB, both leading to vastly different price trajectories.
The 1-week chart reveals a compelling quadruple bottom formation for SHIB. If this pattern materializes, it could suggest a bullish surge of up to 250% from its breakout point, as delineated in prior assessments. Conversely, a starkly contrasting pattern emerges in the form of a descending triangle, which has taken shape over a span of 60 weeks. A conclusive break below its defining neckline could induce substantial declines in SHIB’s valuation.
Shiba Inu Price:
Currently, the bearish sentiment around Shiba Inu seems to be intensifying in the wake of the crypto market downturn. With SHIB recording a price of $0.00000695 at the press time and briefly touching a low of $0.00000674 yesterday, it has breached the descending triangle’s neckline pegged at $0.00000715.
Should SHIB close this week below this key support level, it might portend strong bearish implications, possibly steering the price toward its annual low of $0.000006. Yet, a closure below $0.00000715, while foreboding, is not conclusively bearish.
An analogous dip occurred in June, which was swiftly followed by a robust rally. Over an 8-week period, SHIB ascended by 59%, only to face resistance at the 50-day EMA of $0.00001140, leading to a renewed breach under the descending triangle’s trend line on the weekly chart.
At this juncture, if SHIB can secure a weekly close above the $0.00000715 mark either this week or the next, it might bolster the case for the bullish quadruple bottom setup. So SHIB could see a similar rally to June this year.
From a technical viewpoint, the cryptocurrency will then confront key resistance barriers: the 20-day EMA at $0.00000806, the descending triangle’s trendline approximately at $0.000009, and the 50-day EMA at $0.00001019. Subsequently, a monumental target, pinpointed at the 23.6% Fibonacci retracement level of $0.00002545, representing a rally in excess of 250%, could be attainable.
When interpreting these patterns, investors must decide whether the quadruple bottom or the descending triangle holds more weight for them, making it a buy or sell position.
Community Insights
In a recent post on X (previously known as Twitter), prominent SHIB influencer, Lucie, urged the Shiba Inu community to persevere: “In these turbulent times, it’s imperative for us to remain resilient. The crypto landscape is indeed tumultuous, inundated with unsettling global updates. However, as the formidable ShibArmy, our collective endeavours will undoubtedly yield dividends. Let’s remain united, weathering challenges and championing our shared vision.”
Investors and traders are encouraged to exercise caution and conduct due diligence, keeping a close watch on the unfolding SHIB price narrative.
Featured image from Shutterstock, chart from TradingView.com


