

OpenSea ‘unaware’ of any involvement of former exec in $60M rug pull
October 9, 2023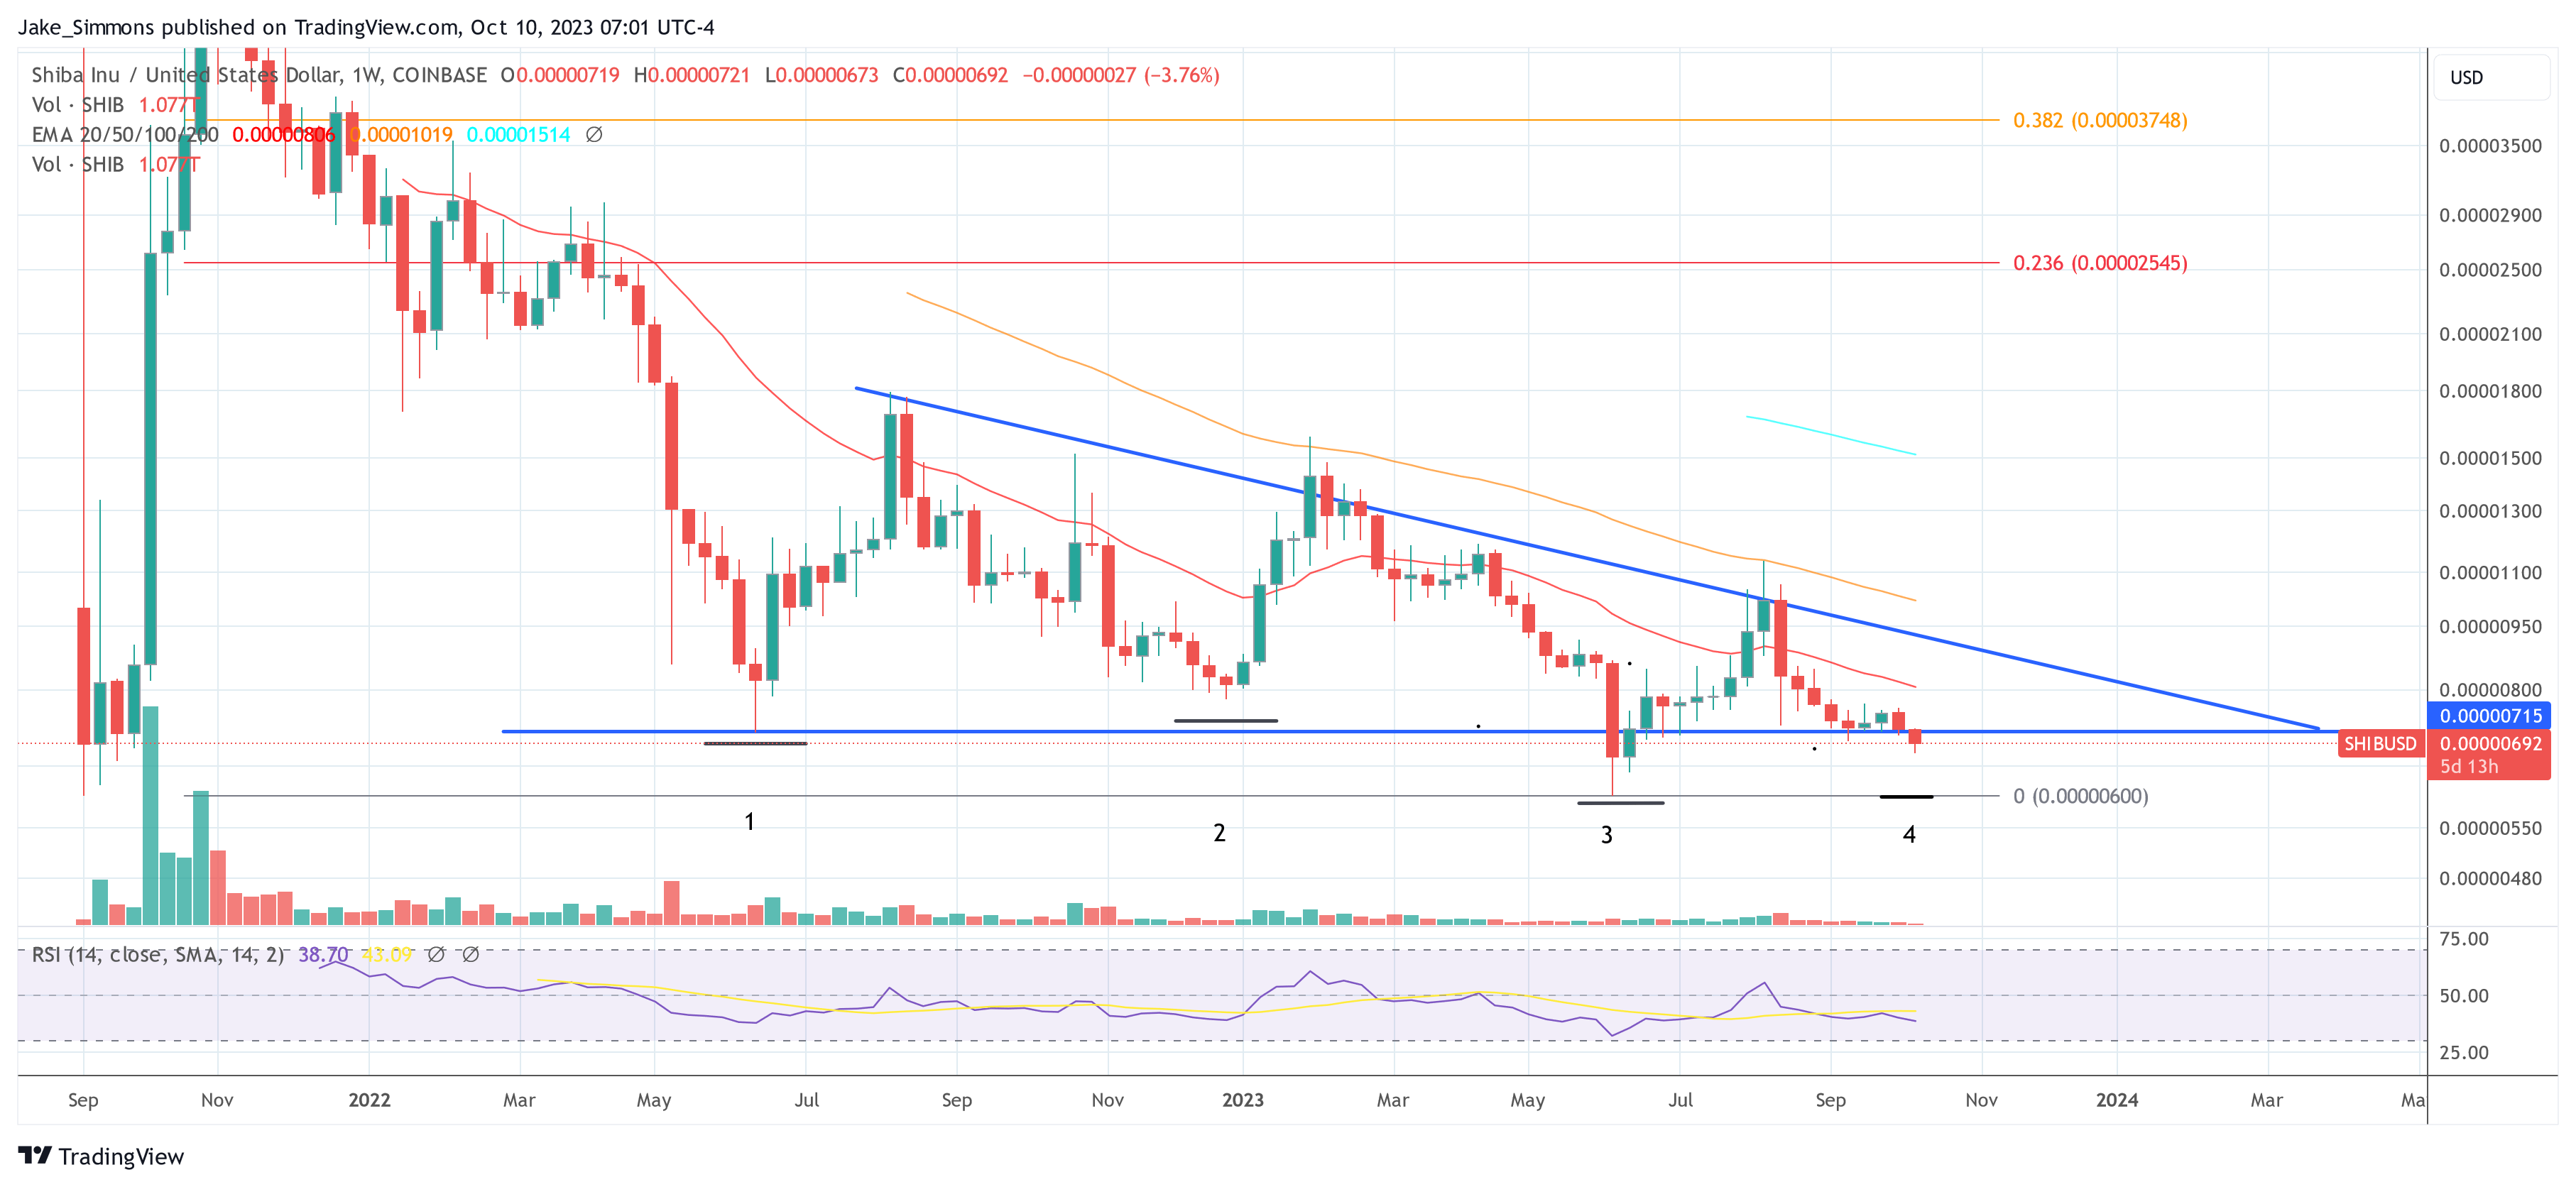
Shiba Inu Price Dips Below Key Support: Enter Or Exit SHIB?
October 10, 2023
Bitcoin is currently trying to have another go at the $28,000 level. Here’s what on-chain data says regarding whether a retest can be successful.
Bitcoin On-Chain Signals Are Not All Positive Right Now
In a new post on X, the on-chain analytics firm Santiment has looked into a couple of on-chain indicators that may provide some hints about whether BTC can sustain any bullish momentum currently or not.
The first metric of relevance is the “supply on exchanges,” which keeps track of the percentage of the total Bitcoin supply that’s currently sitting in the wallets of all centralized exchanges.
When the value of this metric decreases, it means that withdrawals are taking place on these platforms right now. Generally, investors take out their coins to self-custodial wallets whenever they intend to hold onto them for extended periods, so this kind of trend can have a bullish effect in the long term.
On the other hand, the reverse trend implies selling may be going in the market as holders are depositing a net amount of the cryptocurrency to the exchanges at the moment.
Now, here is a chart that shows the trend in the Bitcoin supply on exchanges over the past few months:
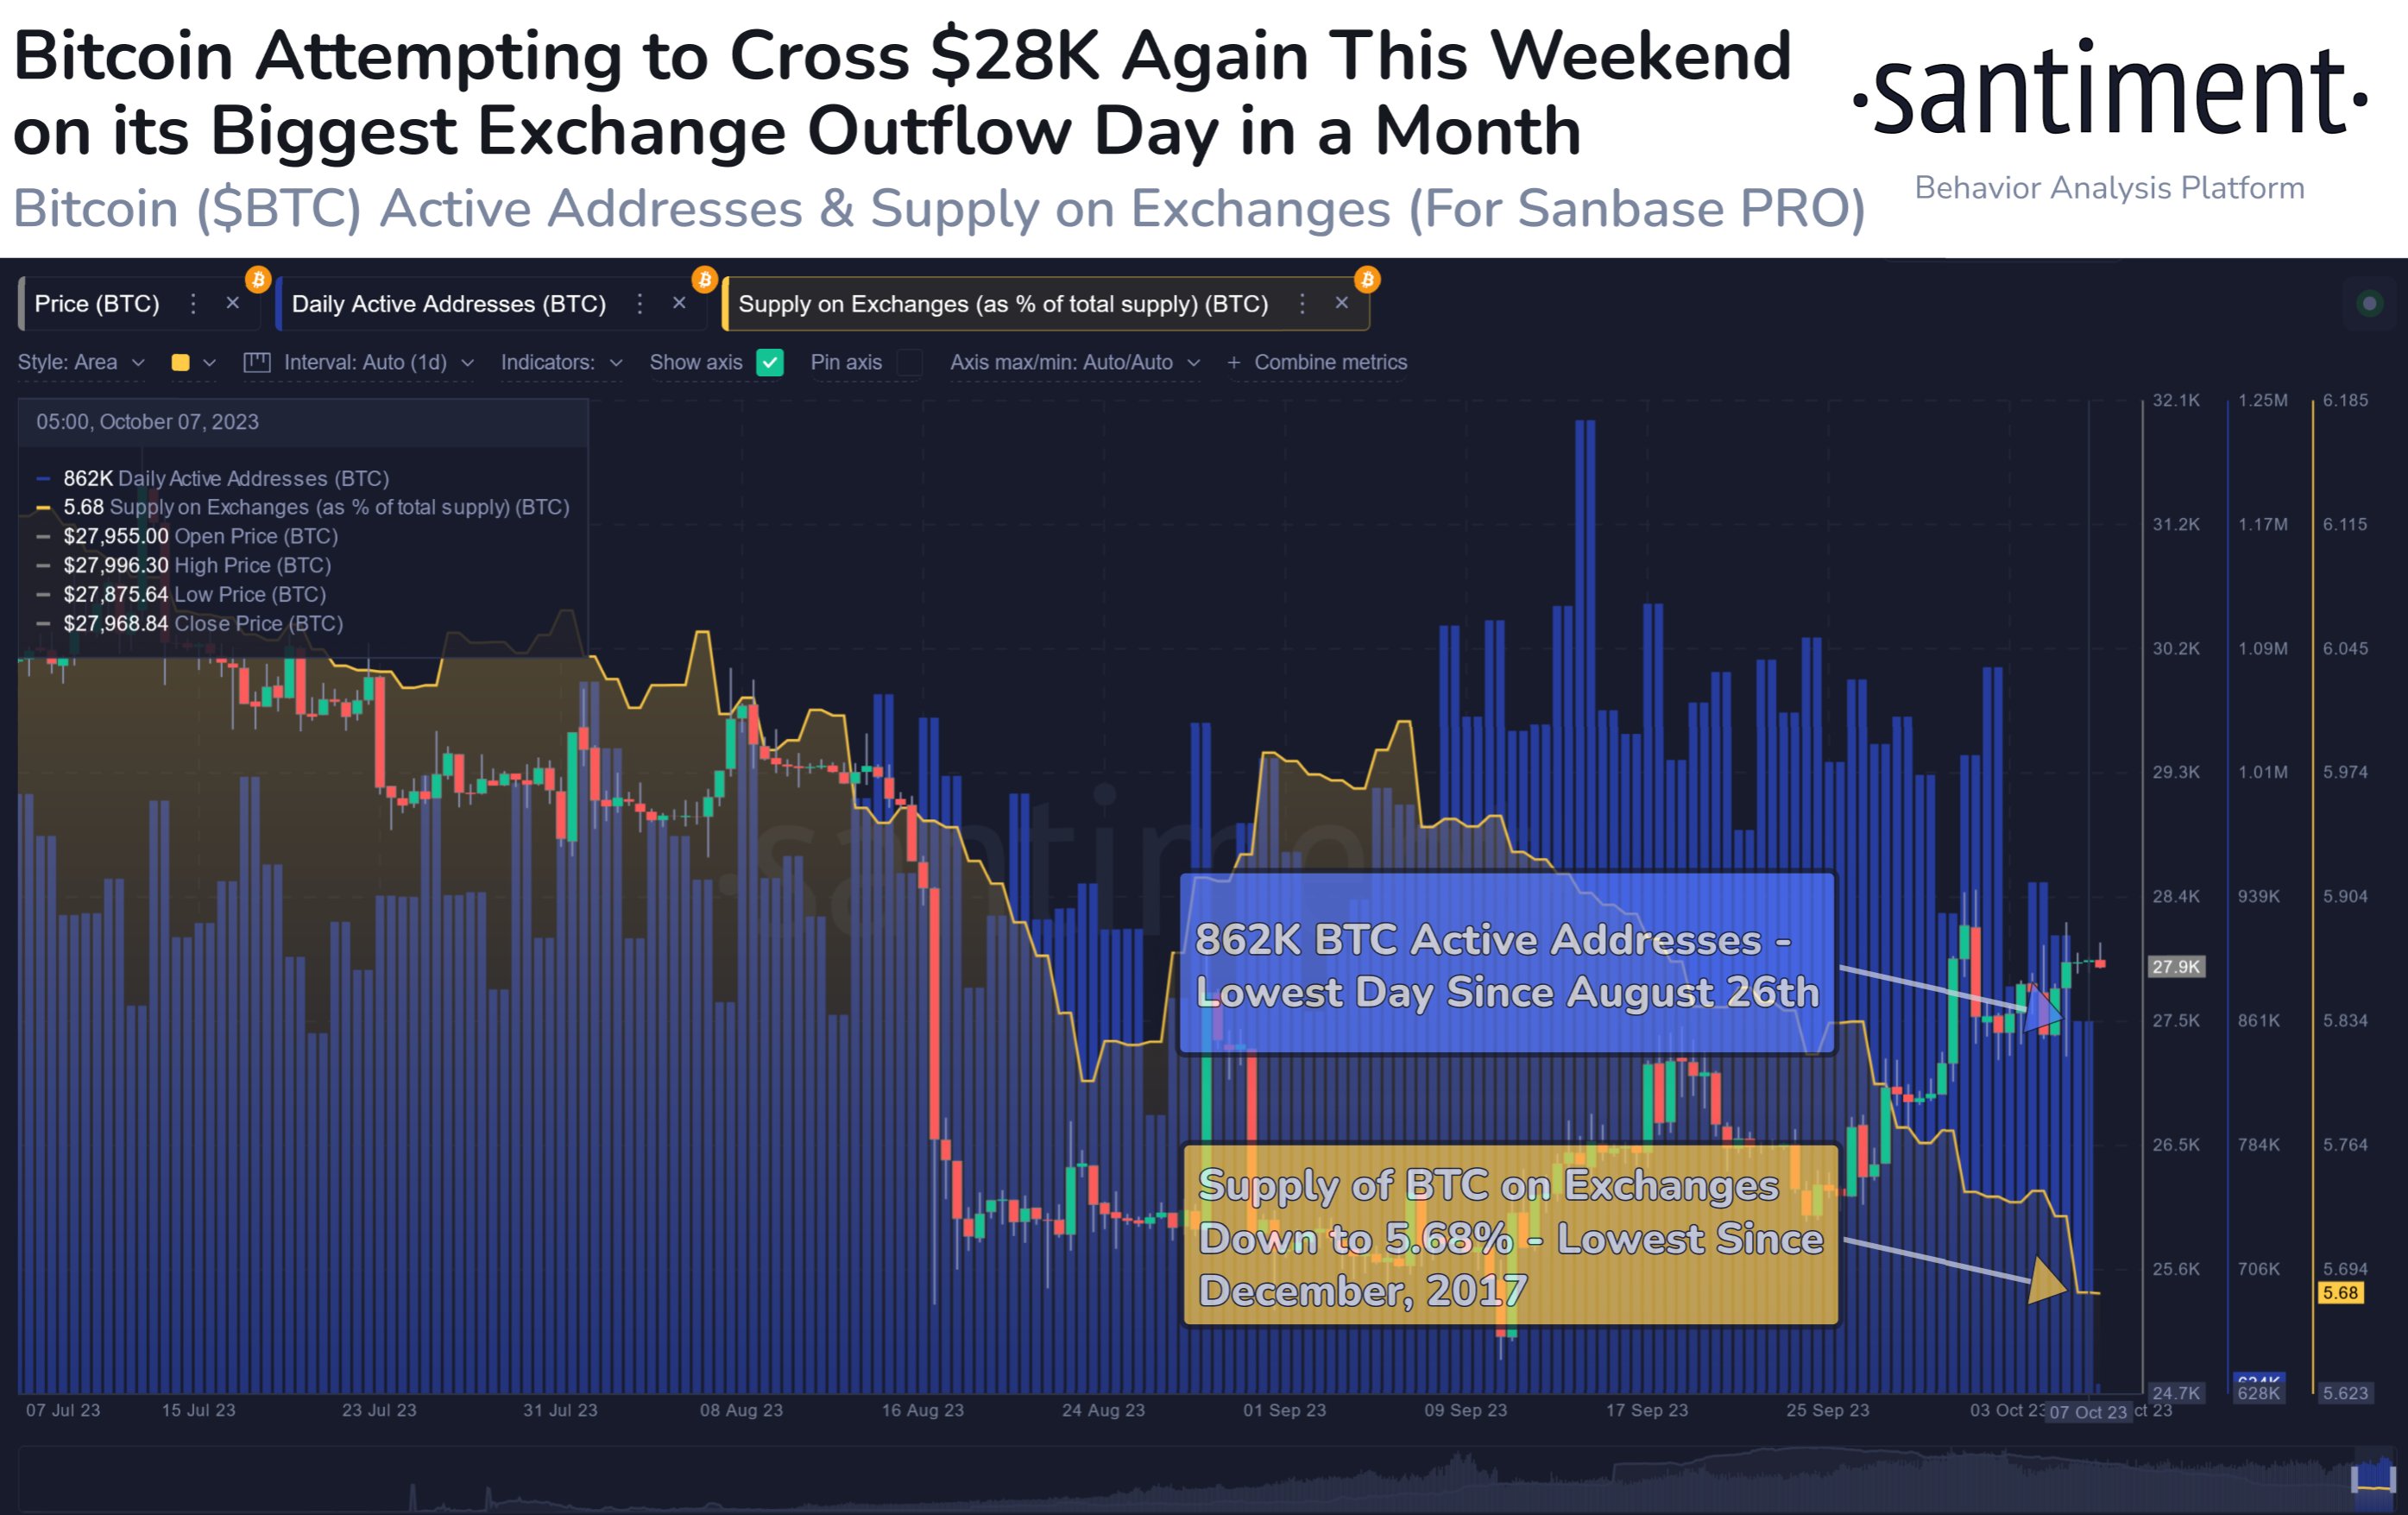
Looks like the value of the metric has been going down in recent weeks | Source: Santiment on X
From the graph, it’s visible that the Bitcoin supply on exchanges has observed a constant decline during the past month. This naturally suggests that the investors are transferring a net number of coins out of these platforms.
As mentioned before, if the investors are accumulating with these withdrawals, the price could feel a bullish impact, although it may only appear in the long term. Therefore, these outflows may not directly be relevant to the current price surge.
Another way to look at the net withdrawals, however, is that at the very least net deposits aren’t taking place currently. As is visible from the chart, the recovery rally at the end of August very quickly died out as investors transferred a large amount of BTC toward exchanges.
For now, it would appear that such a selloff isn’t taking place, which could potentially allow for the asset’s run to continue. There is another indicator highlighted in the graph, but unlike the supply on exchanges, this one doesn’t seem to be showing a positive trend.
This metric is the “daily active addresses,” which keeps track of the unique number of addresses that are participating in transaction activity on the blockchain. This indicator has now plunged toward the lowest levels since late August, implying that user interest in the asset is low currently.
Historically, rallies have only been sustainable when they have been able to amass a large amount of trader attention, as such moves typically require a high amount of fuel. At present, the current recovery move lacks such investor activity.
On top of this, the $27,900 level is currently a point of major resistance, as that’s where the average cost basis of the short-term holders lies, as CryptoQuant analyst Maartunn has pointed out.
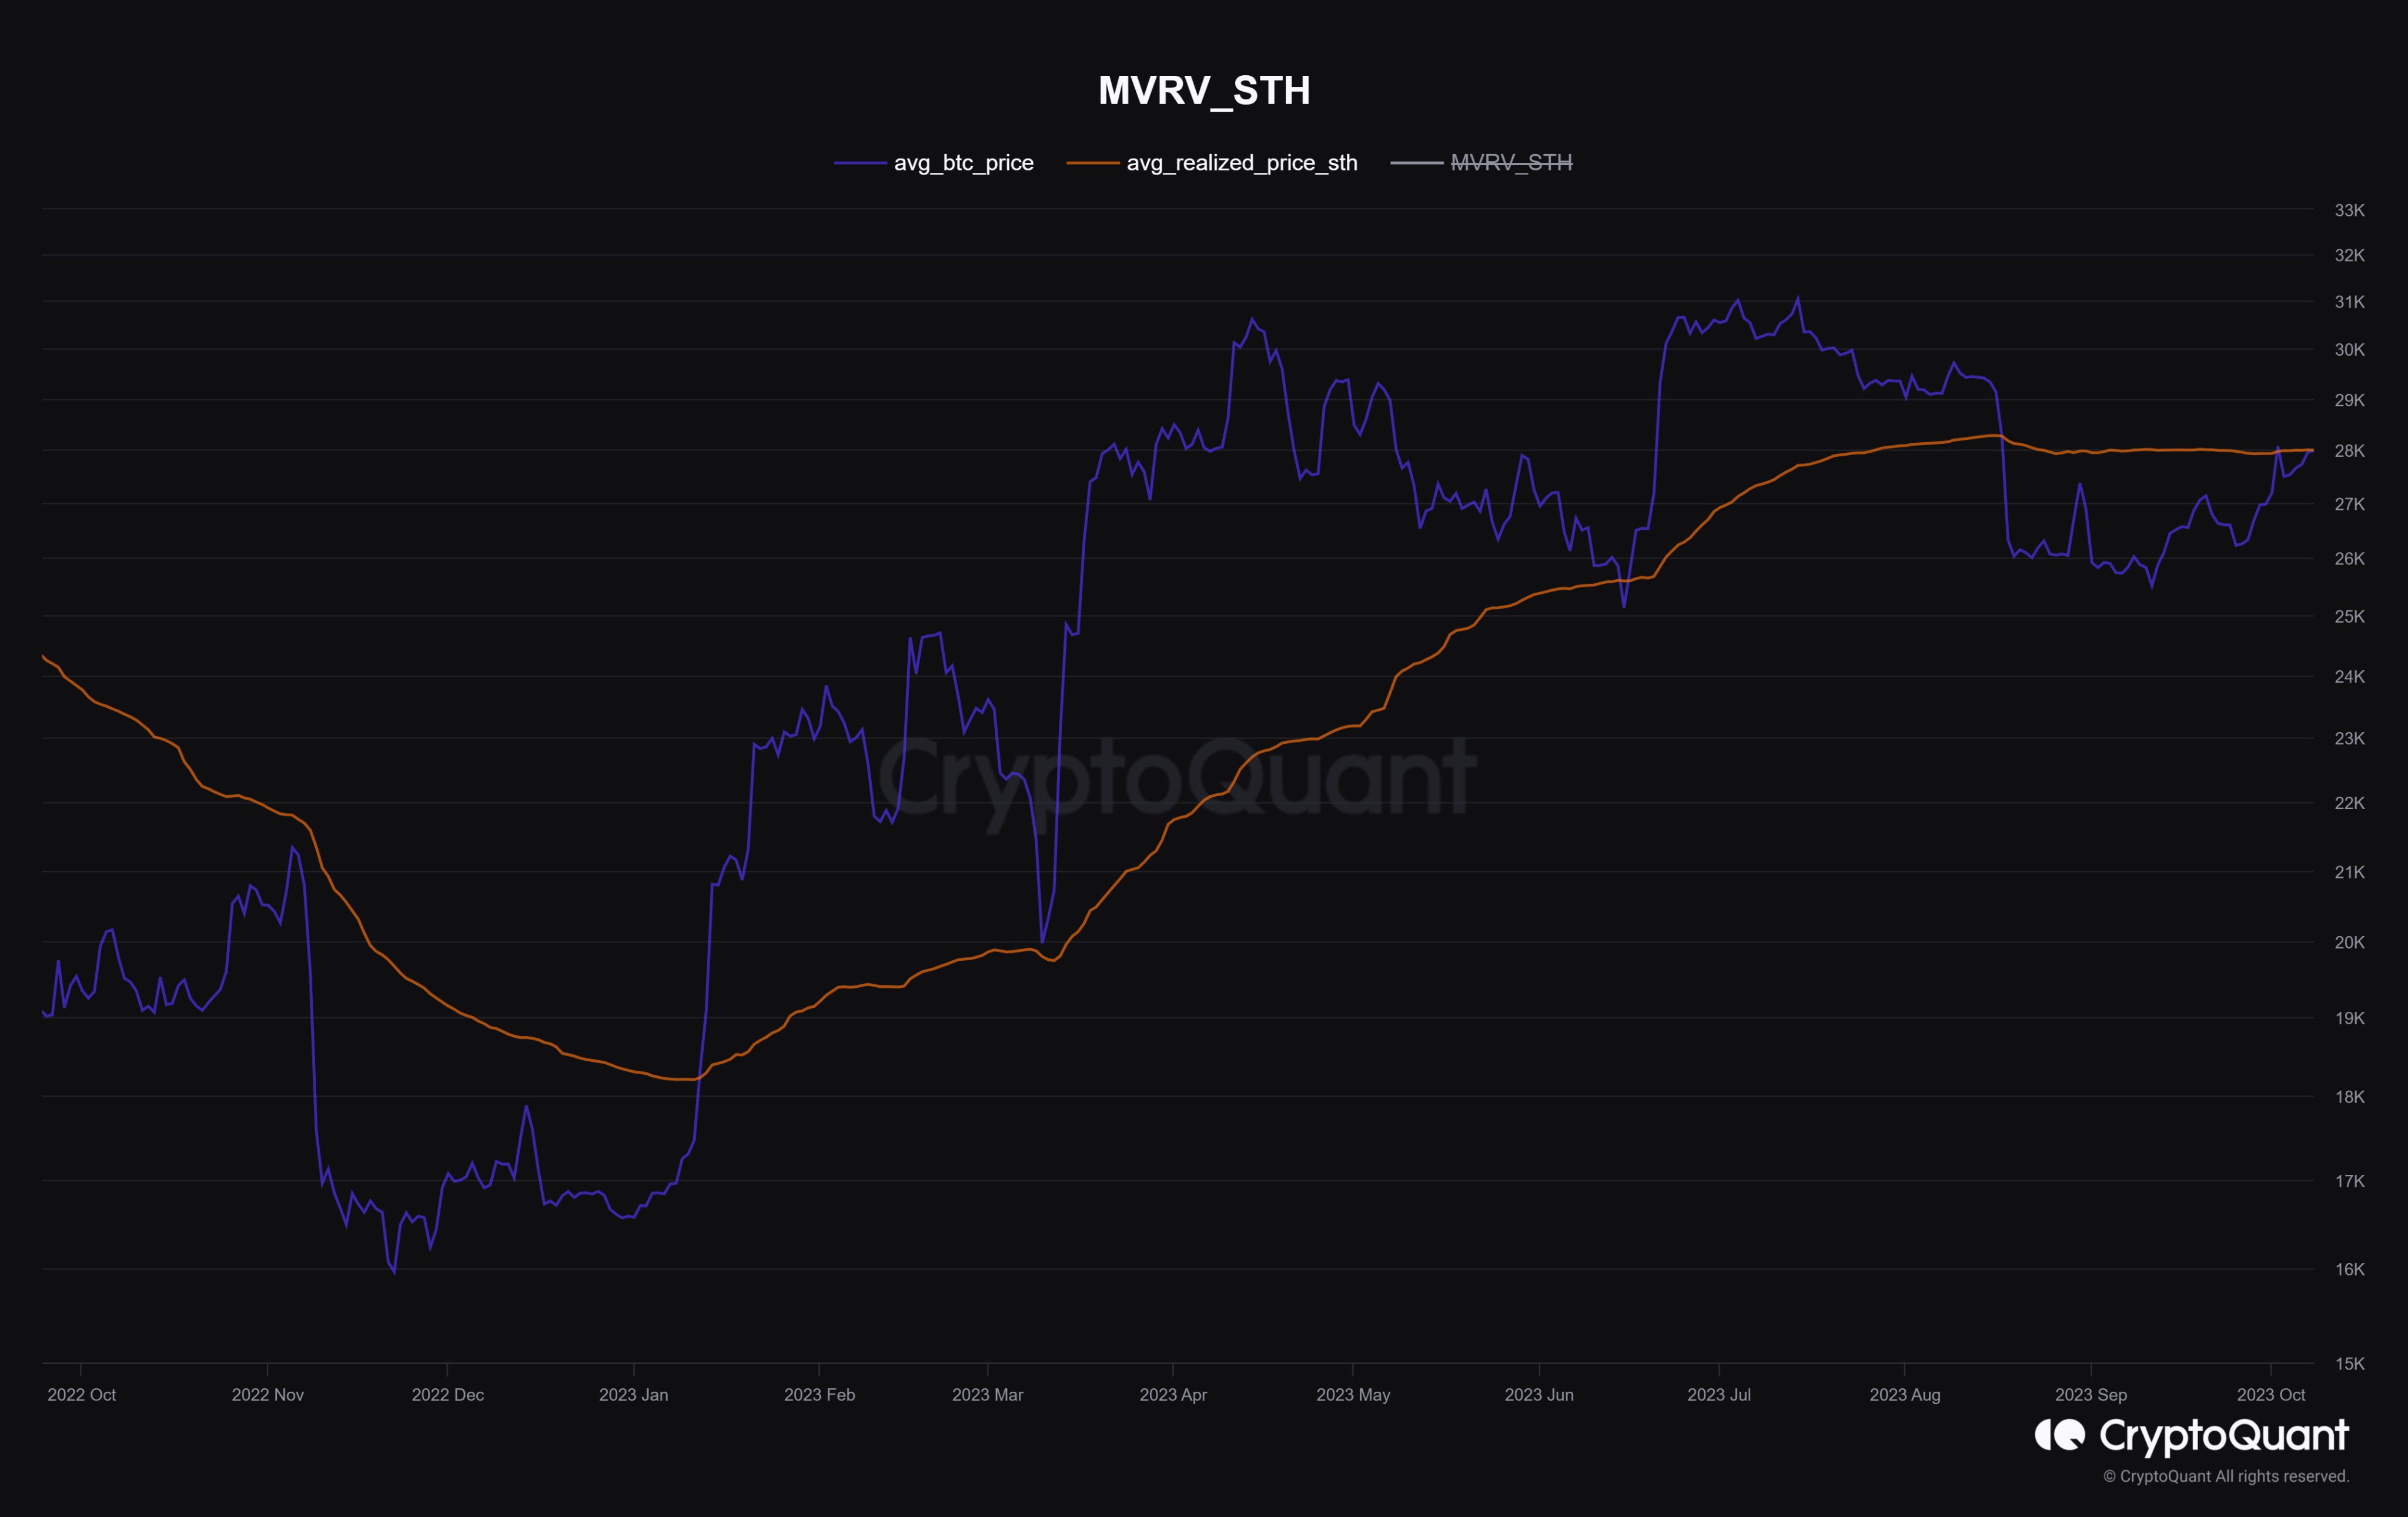
BTC is currently retesting this level | Source: @JA_Maartun on X
All in all, it looks like a significant break above the $28,000 level could prove to be quite tricky for the cryptocurrency in the near future unless things can turn around fast in terms of user interest.
BTC Price
Bitcoin’s latest attempt may be ending in failure once again as its price has now retraced towards $27,600.
BTC has plunged during the last few hours | Source: BTCUSD on TradingView
Featured image from Kanchanara on Unsplash.com, charts from TradingView.com, CryptoQuant.com, Santiment.net


