

Fidelity Acquires 10% Stake in Bitcoin Mining Firm Hut 8
July 14, 2020
Testnet Results Suggest Matic Could Power Ethereum to 7,200 TPS
July 15, 2020
Bitcoin is facing an uphill task near $9,300 and $9,400 against the US Dollar. BTC seems to be preparing for the next big move either above $9,400 or below $9,000.
- Bitcoin is stuck in a broad range above the $9,120 support zone.
- The price is struggling to clear the $9,300 and $9,400 resistance levels.
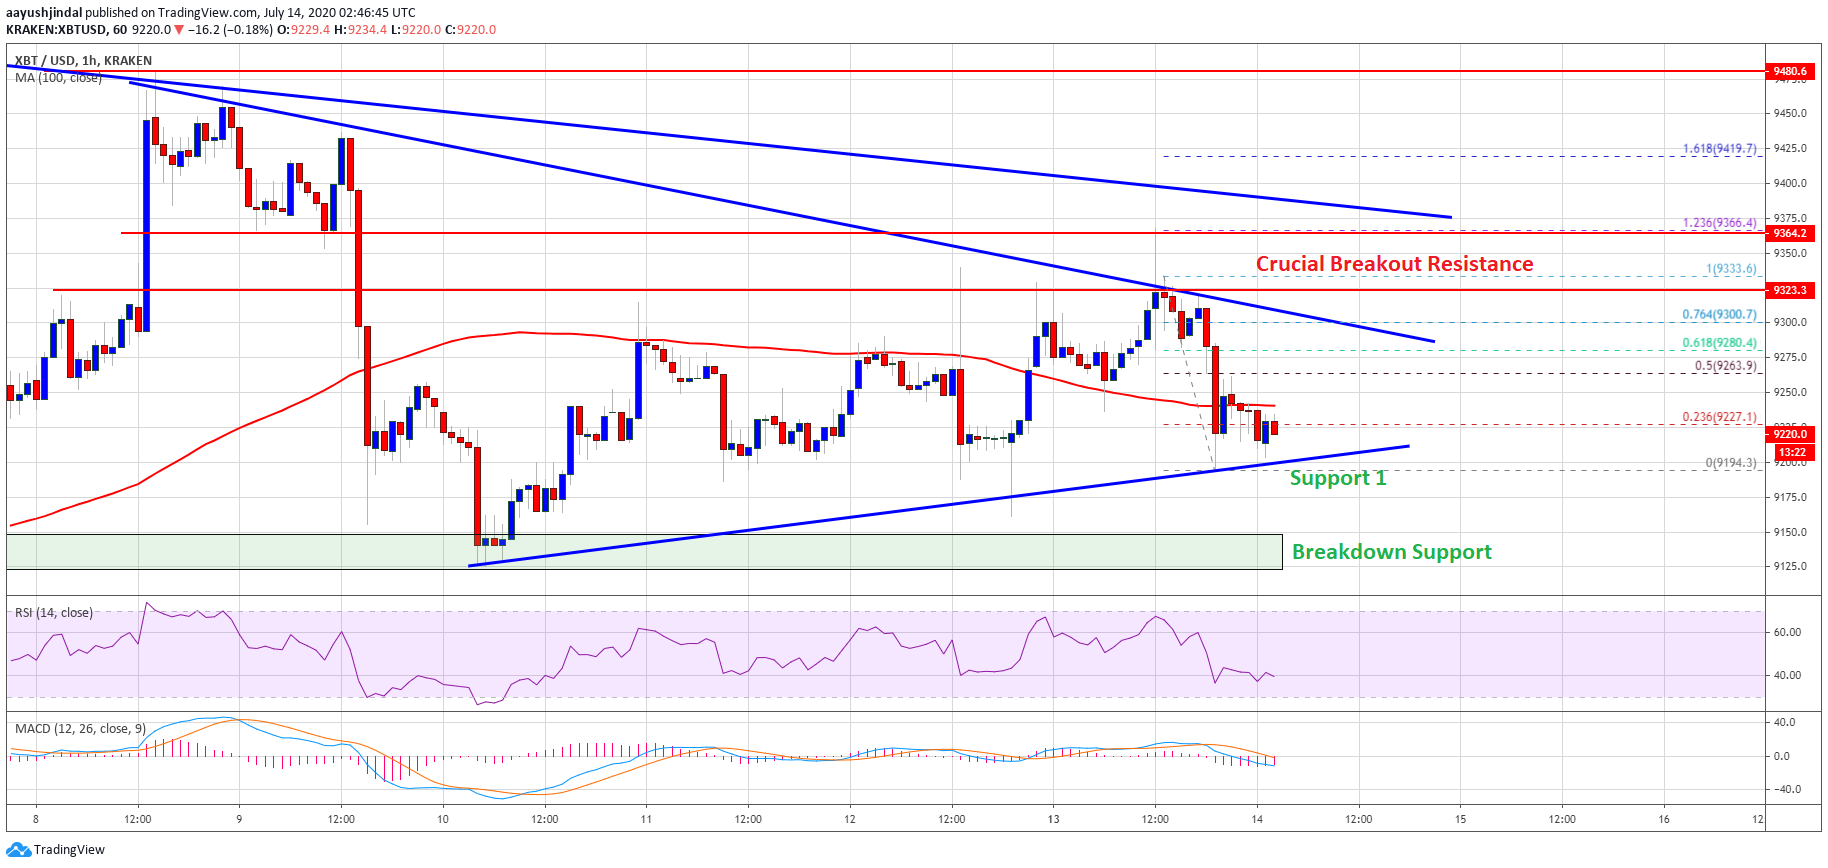
- There is a crucial breakout pattern forming with resistance near $9,300 and $9,360 on the hourly chart of the BTC/USD pair (data feed from Kraken).
- The pair could either start a strong rally above $9,300 or it might dive below $9,100.
Bitcoin Price is Approaching Next Significant Break
Recently, bitcoin made another attempt to gain strength above $9,300 against the US Dollar. BTC retested the $9,330 resistance zone, which prevented an upside break once again.
A high was formed near $9,333 and the price started a fresh decline. It traded below the $9,250 and $9,220 levels. There was also a close below the $9,250 level and the 100 hourly simple moving average.
A low is formed near $9,194 and it seems like the price is holding the $9,200 support zone. An immediate resistance is near the $9,240 level or the 100 hourly simple moving average. The first major resistance is near the 50% Fib retracement level of the recent decline from the $9,333 high to $9,194 low.
Bitcoin price testing $9,200: Source: TradingView.com
The next key hurdle is forming near the $9,300 level. It is close to the 76.4% Fib retracement level of the recent decline from the $9,333 high to $9,194 low. More importantly, there is a crucial breakout pattern forming with resistance near $9,300 and $9,360 on the hourly chart of the BTC/USD pair.
To start a strong increase and a rally, the price must gain strength above the $9,300, $9,330 and $9,360 resistance levels. Finally, a successful close above the $9,400 pivot level could open the doors for a larger upward move.
Bearish Break in BTC
Bitcoin price seems to be holding the $9,200 and $9,120 support levels. If it continues to struggle near $9,300, there is a risk of a downside break.
A proper close below the $9,120 support zone may perhaps start a significant bearish move. The next support could be $9,000, followed by the $8,800 weekly pivot level.
Technical indicators:
Hourly MACD – The MACD is currently gaining momentum in the bearish zone.
Hourly RSI (Relative Strength Index) – The RSI for BTC/USD is now well below the 50 level.
Major Support Levels – $9,200, followed by $9,120.
Major Resistance Levels – $9,260, $9,300 and $9,360.


