
US crypto regulation bill aims to bring greater clarity to DAOs
July 11, 2022
XTZ Nears 3-Week High, UNI Remains Close to 2-Month High – Market Updates Bitcoin News
July 11, 2022
Cardano (ADA) has been unable to follow through with its weekend bullish momentum. The cryptocurrency lost last week’s gains and seems poised for further losses as the crypto market trends sideways.
Related Reading | TA: Bitcoin Price Trims Gains, Key Breakdown Support Nearby
At the time of writing, Cardano (ADA) trades at $0.44 with a 5% loss in the last 24 hours.
The cryptocurrency is at critical levels as $0.40 was operated as support during these past months’ bearish downside price action. Losing these levels could push ADA’s price back to its 2020 levels.
At that time, the cryptocurrency experienced a massive rally after a long period of sideways movement and consolidation. From 2019 until 2020, Cardano traded below $0.5 and $0.15 which would represent a devasting loss for investors that bought ADA in the past two years.
Legendary trader Peter Brandt suggests ADA could start descending into its 2020 levels. As seen below, Brandt claims that ADA’s price is following a head and shoulders pattern which spells future depreciation for this cryptocurrency.
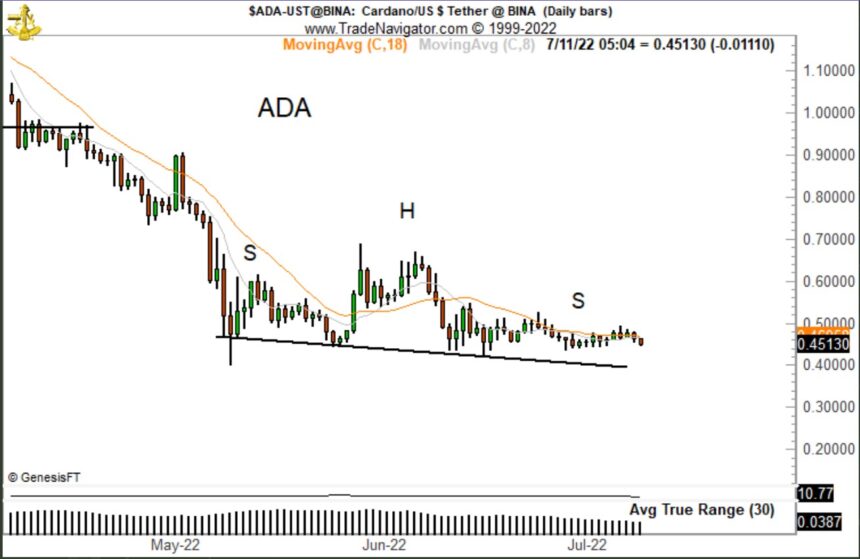
The legendary trader called ADA’s price chart “the very definition of ugly” and set $0.40 as a potential price target to the downside.
This head and shoulders pattern could be invalidated if Cardano’s bulls managed to push the price above $0.70 in the short term. Otherwise, there is little support for Cardano below $0.40.
Data from Material Indicators (MI) shows that most of the liquidity for the ADAUSDT trading pair is sitting above $0.44. There are around $1.5 million in bid orders below ADA’s price current levels and around $1 million in asks orders in the opposite direction.
If the price follows the head and shoulders pattern into $0.40, as Brandt suggested, and continues to trend downside there are no bid orders that could operate as support. Therefore, ADA’s price could experience downside volatility.
Can Cardano Avoid A Doom Scenario?
At the same time, ADA’s price records a thin order book to the upside. If the price can sustain its current levels and make a run towards $0.50, there could be a change at invalidating Brandt’s head and shoulders pattern.
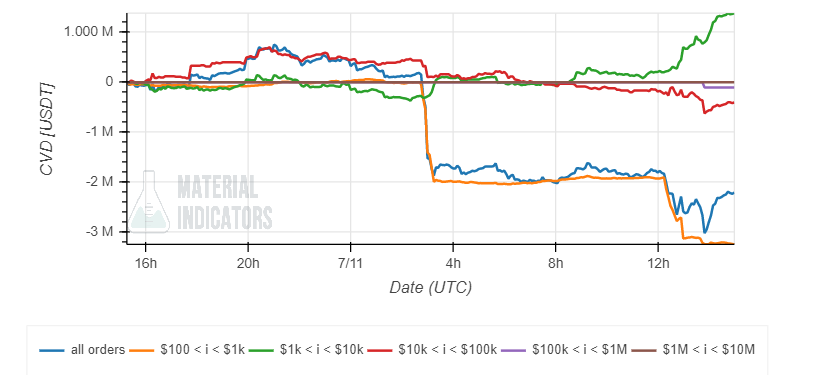
Material Indicators record an increase in selling pressure from retail investors. Investors with bid orders of around $1,000 (green in the chart below) have begun buying into Cardano’s price action.
Analysts from Material Indicators believe investors with these bid orders (in green below) are whales camouflaging as smaller investors. The relevance of Cardano’s current levels and the sudden increase in these orders suggests this possibility is likely for short timeframes.
Related Reading | TA: Ethereum Revisits Key Support, Can The Bulls Protect More Losses
Maybe these ADA whales have begun accumulating and could be able to defend these levels. In higher timeframes, all investors class have begun selling including investors with asks orders of around $100,000 which supports Brandt’s scenario.


