

Flipstarter Campaign Aims to Raise Funds for Viral Bitcoin Cash Marketing
August 17, 2020
Pantera Capital Has Raised 3x More This Year Than It Did in 2019
August 17, 2020
Tron price rallied over 10% and it surpassed the $0.0250 and $0.0260 resistance levels against the US Dollar. TRX is currently correcting gains, but it is likely to continue higher towards $0.0300.
- Tron price is gaining bullish momentum above the $0.0260 resistance against the US dollar.
- The price traded to a new weekly high at $0.0289 and it is currently correcting lower.
- There was a break above a key ascending channel with resistance near $0.0264 on the 4-hours chart of the TRX/USD pair (data source from Bitfinex).
- The pair is likely to continue higher towards $0.0300 or even $0.0320 as long as it is above $0.0240.
Tron Price Gaining Bullish Momentum
In the past three sessions, tron price gained momentum against the US Dollar, and it outperformed bitcoin and ethereum. TRX traded above the $0.0250 resistance area to start a fresh increase.
The upward move was strong, as the price surpassed the $0.0260 level and settled nicely above the 100 simple moving average (4-hours). During the rise, there was a break above a key ascending channel with resistance near $0.0264 on the 4-hours chart of the TRX/USD pair.
The pair traded to a new weekly high at $0.0289 and it is currently correcting lower. It traded below the 23.6% Fib retracement level of the recent wave from the $0.0241 low to $0.0289 high.
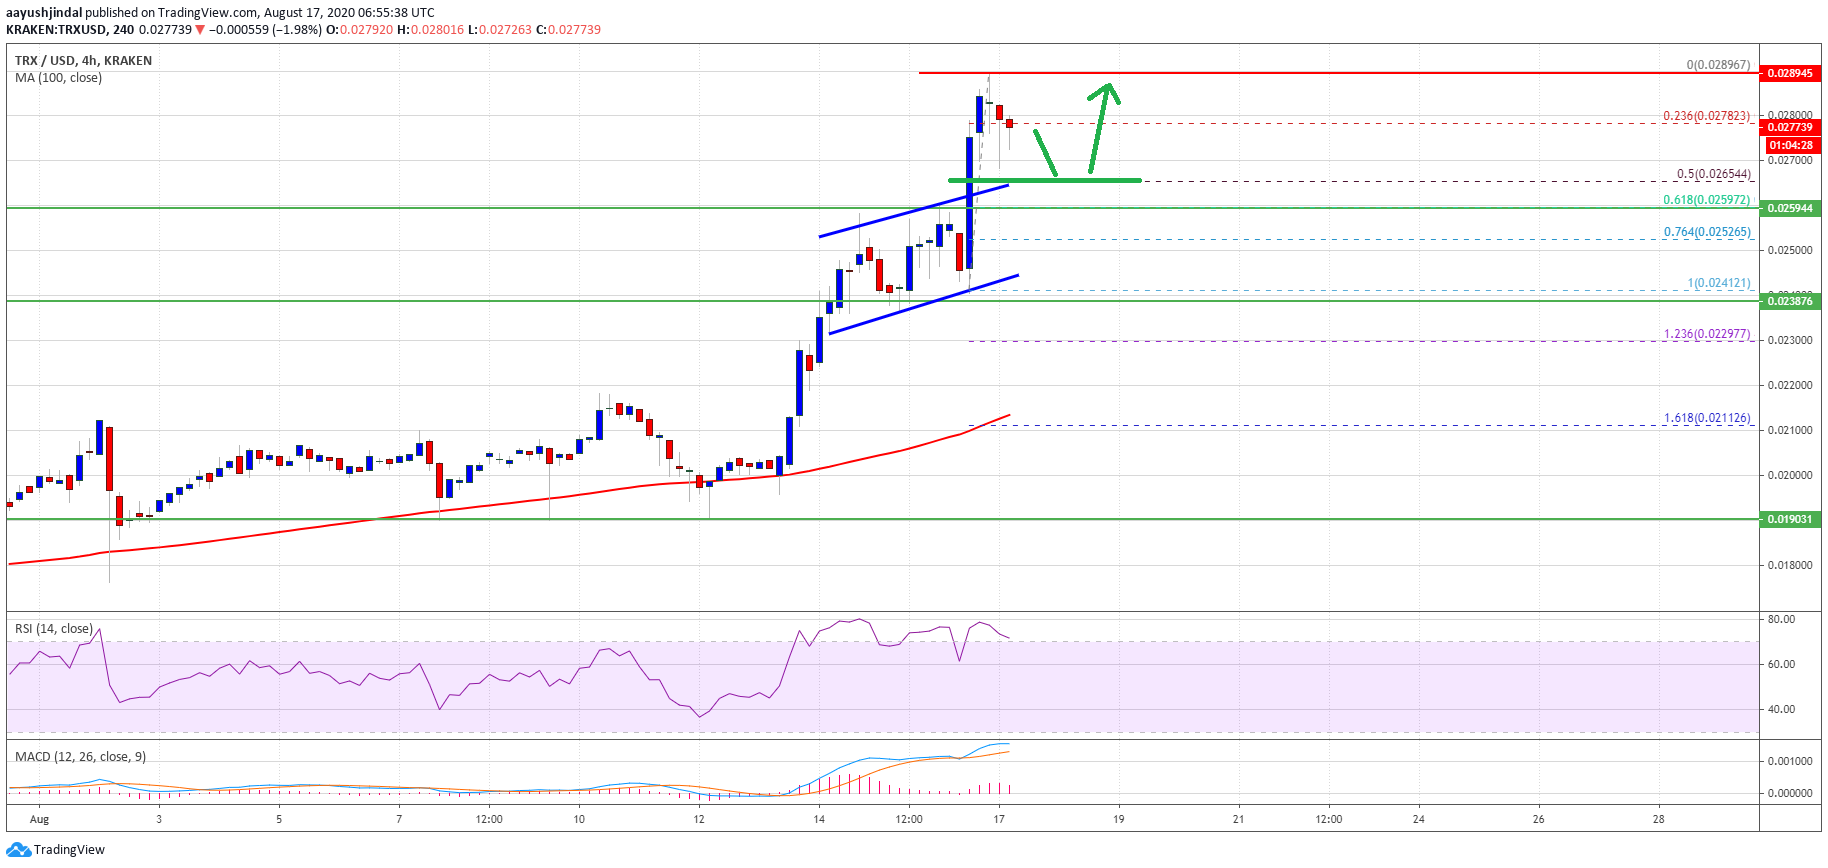
TRX price breaks $0.028. Source: TradingView.com
The first major support on the downside is near the $0.0265 level and the broken channel resistance. It is also close to the 50% Fib retracement level of the recent wave from the $0.0241 low to $0.0289 high.
On the upside, the bulls are facing hurdles near the $0.0285 and $0.0288 levels. The main resistance is now near the $0.0300 level, above which the price is likely to accelerate higher towards the $0.0320 level in the coming sessions.
Dips Likely to be Supported in TRX
If TRX price corrects lower, it is likely to remain supported near the $0.0265 breakout zone. The next major support is near the $0.0250 pivot level.
Any further losses may perhaps push the price further lower towards the $0.0240 level, below which the bulls are likely to lose control in the near term.
Technical Indicators
4-hours MACD – The MACD for TRX/USD is gaining momentum in the bullish zone.
4-hours RSI (Relative Strength Index) – The RSI for TRX/USD is currently correcting lower from the 80 level.
Major Support Levels – $0.0265, $0.0250 and $0.0240.
Major Resistance Levels – $0.0288, $0.0300 and $0.0320.


