

Consultancy firm to investigate blockchain transactions in QuadrigaCX case
September 8, 2020
CEX.IO to Offer Instant Cryptocurrency-Backed Lending Service in 217 Countries and Territories
September 9, 2020
Bitcoin has collapsed by over $2,000 since the highs of last week. Even after a slight bounce at the $9,800 lows, BTC remains 20% below those highs.
Bitcoin’s inability to capture key resistances in the $10,500-11,000 region has left some analysts concerned. The concerned say that consolidation under $10,500 may trigger a move to the $9,000s, maybe even lower. Their sentiment is based on the fact that $10,500 has marked three separate BTC rallies over the past year, meaning it’s a level of importance.
A simple fractal, though, suggests that the price of the leading cryptocurrency has bottomed.
In technical analysis, a fractal is when an asset’s price action is repeated on another asset and/or time frame. As Investopedia explains, “Although prices may appear to be random, they actually create repeating patterns and trends. One of the most basic repeating patterns is a fractal.”
Related Reading: Here’s Why This Crypto CEO Thinks BTC Soon Hits $15,000
Bitcoin Has Bottomed: Fractal Analysis
According to one trader, Bitcoin’s recent price action is a dead ringer for BTC’s consolidation pattern in May of this year. During May, BTC consolidated in the $9,000s for a number of weeks as it flirted with the $10,000 resistance.
The fractal analysis suggests that Bitcoin’s correction from the $12,000 highs to current prices is the worst of the drawdown. It also indicates that Bitcoin is likely to move higher in the coming weeks back towards the $11,000-12,000 trading range.
Speaking on the potential veracity of the fractal, the trader in question said:
“Expanded thoughts on this, price is fractal and you see the same price patterns on all time frames. I’m still unsure if this current PA is the bottom or not- I switch ideas every hour. Compared May 10th again to now.”
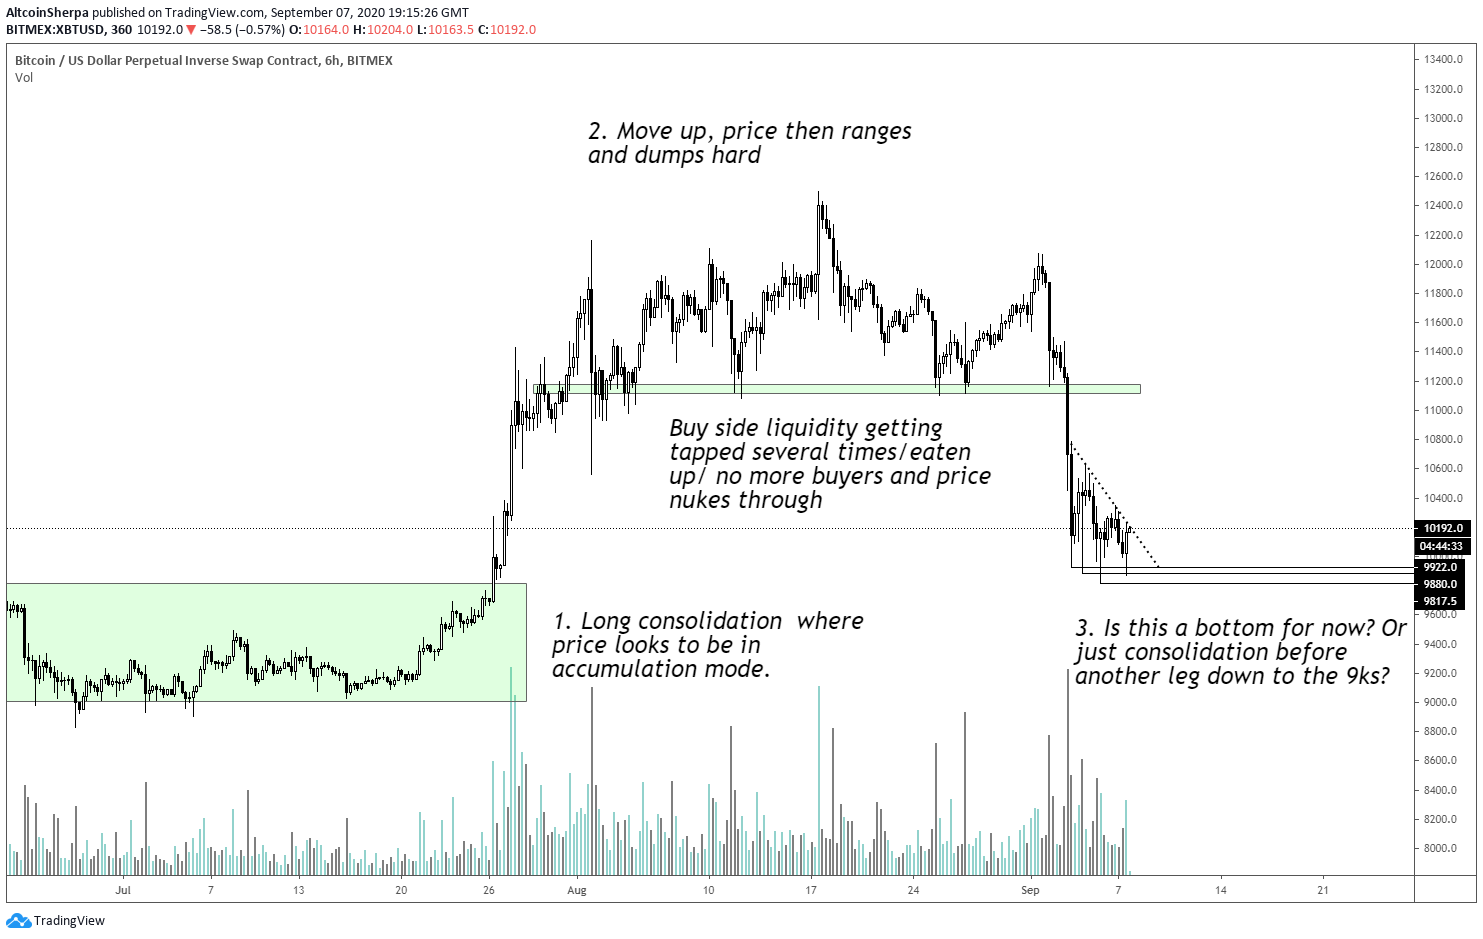
Chart of BTC's price action over the past few weeks with a fractal analysis by crypto trader "Altcoin Sherpa." Chart from TradingView.com
Lack of Selling Pressure Is Also Signaling a Bottom
Adding to the expectation that Bitcoin has bottomed here are a number of selling pressure analyses.
One trader shared the chart below on September 7th, showing the movement of Bitcoin’s on-balance volume metric. On-balance volume, or OBV, is a metric “intended to relate price and volume in the stock market.”
The chart suggests that the selling pressure has subsided and that accumulation should be expected for the next few weeks.
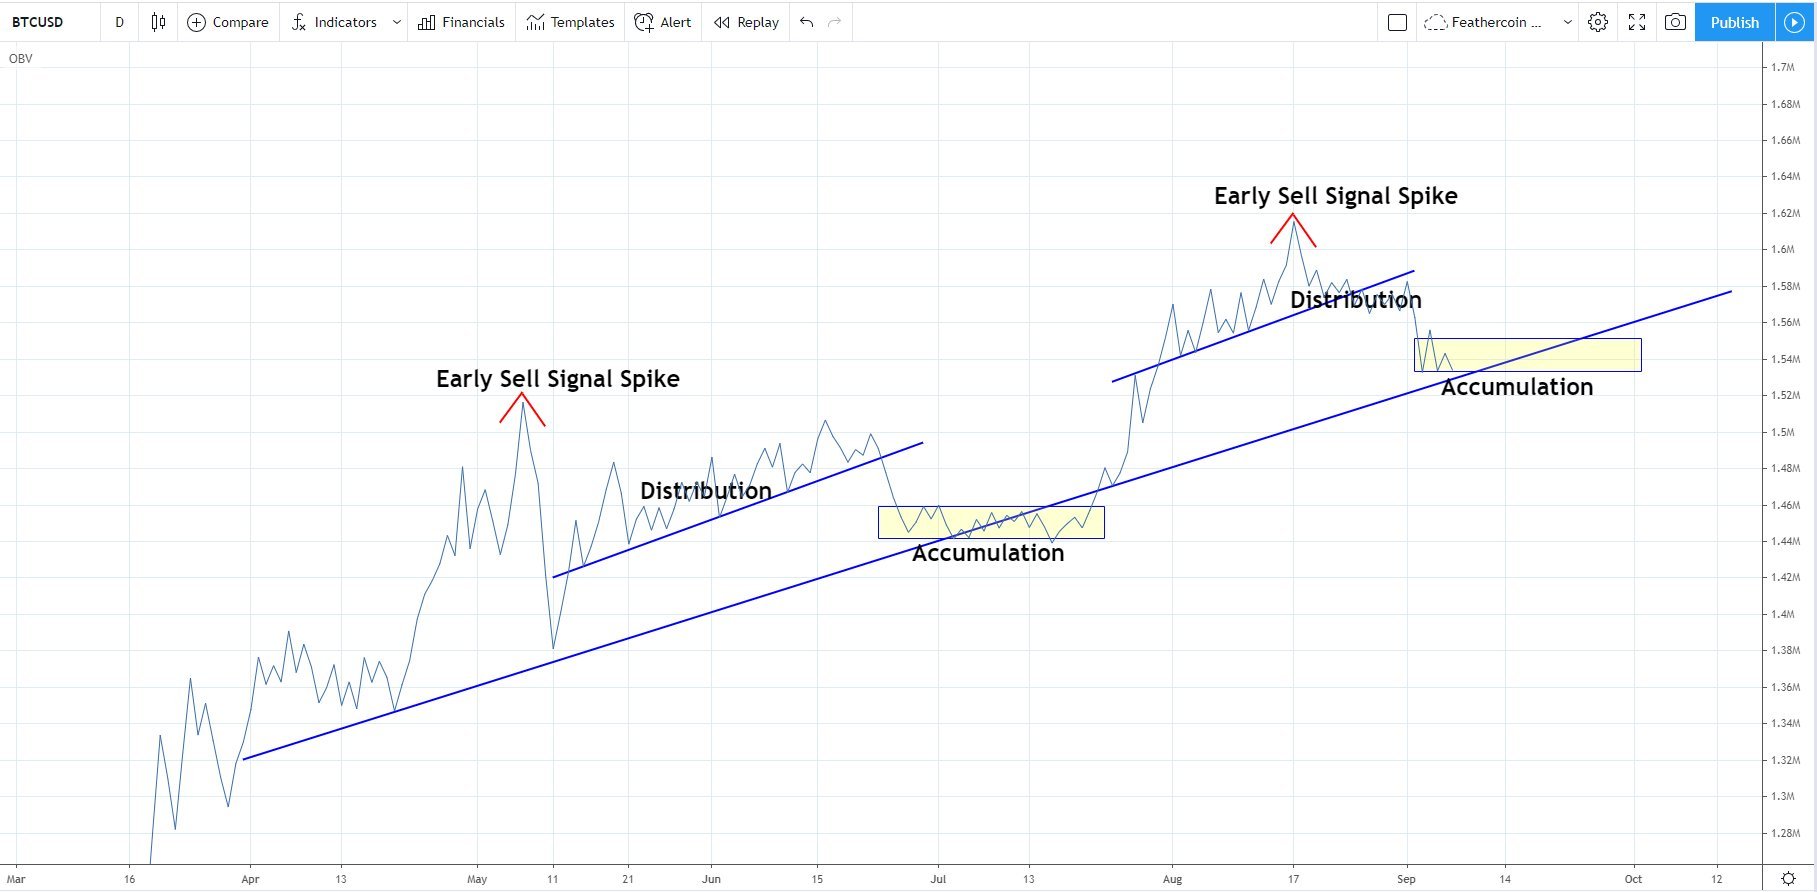
Chart of BTC's on-balance volume over the past few months by crypto analyst IncomeSharks (@Incomesharks on Twitter). Chart from TradingView.com
On-chain data also shows that miners have finally begun to slow withdrawals of BTC from their wallets. This comes after an influx of selling pressure that analysts say caused the ongoing downtrend.
Related Reading: These 3 Trends Suggest BTC Is Poised to Bounce After $1,000 Drop
Photo by Mads Schmidt Rasmussen on Unsplash
Price tags: xbtusd, btcusd, btcusdt
Charts from TradingView.com
This Simple Fractal Indicates Bitcoin Has Bottomed After $2,000 Drop


