

George Soros’ Investment Fund Is Reportedly Trading Bitcoin Products – Finance Bitcoin News
July 1, 2021NBA’s Portland Trail Blazers to wear crypto logo for next five years
July 2, 2021
The next 6 months will make or break S2F, the most famous Bitcoin model, says PlanB who popularized the method.
The Stock-To-Flow Model
The S2F model is a simple method used to predict asset prices. PlanB first posted a chart for Bitcoin based on the technique back in 2019.
Here is new chart based on the S2F method for Bitcoin’s current price prediction, posted by PlanB on Twitter:
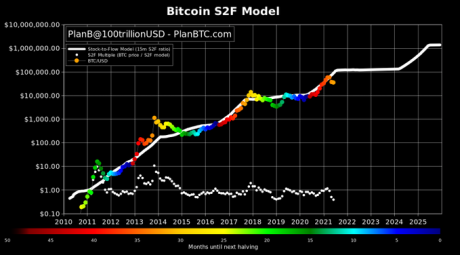
BTC's S2F model | Source: PlanB
The trend predicted by S2F is remarkably close to the real thing. There are a few points of deviation, however, including the current 2021 period.
As the name Stock-To-Flow would imply, it’s calculated by dividing the stock (supply) with the flow (annual production).
Higher the S2F value, more scarce is the commodity. PlanB used this table to showcase how this works:
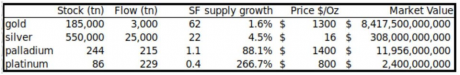
The S2F values of some precious metals | Source: PlanB
As you can see, the above table shows data for a few precious metals.
The SF value indicates how many years it will take based on the production levels (or flow) to mine out the same amount as the current stock.
For example, in the case of gold, the SF value is 62, which indicates it would take 62 years to take the current stock out of ground.
Related Reading | Why This U.S. Congressman Compared Bitcoin Investment With Playing The Lottery
Such a high value means that gold is a relatively scarce commodity compared to, say, silver, which has its SF value at 22.
During 2019, when this table was released, Bitcoin’s SF value was 25, which means it was scarcer than silver, but not gold.
However, there is one thing to note here. BTC is different to gold and other metals in that their S2F value won’t practically increase much.
Current stock-to-flow value of Bitcoin is around 49, which means the cryptocurrency has only gotten scarcer over the years.
The reason behind BTC’s S2F value sharply going up is the halving (where flow is halved). With each halving, the coin will continue to get scarcer.
Now, here is how the S2F value correlates with the price.
Model price (USD) = exp(-1.84) * SF ^ 3.36
The model is based on the above formula. This is how the chart was generated. Looking back at which, in 2019 almost the same amount of deviation was observed as in 2021 right now.
Related Reading | A Never Wrong Bearish Bitcoin Signal Just Triggered
The 2019 price went back in line with the chart shortly after, while it remains to be seen whether the same will happen this time.
Bitcoin Price
At the time of writing, BTC‘s price is around $33k. It’s down about 5% in the last 7 days, and almost 8% in the past month.
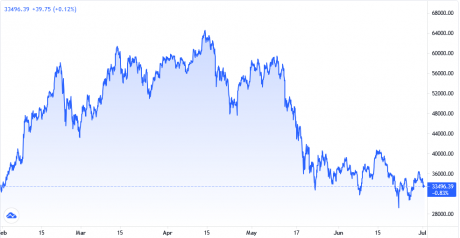
BTC seems to be going down again | Source: BTCUSD on TradingView
Bitcoin seems to be in a bear market right now, but if the S2F model holds true, the price should go up soon to remain in line with it. The next few months will be a real test for the method.


