

Will Polkadot save decentralized finance from Ethereum’s scaling problem?
August 26, 2021
The new episode of crypto regulation: The Empire Strikes Back
August 27, 2021
On-chain data shows stablecoins reserve has hit a new all-time-high (ATH), here’s what it could mean for Bitcoin’s price based on past patterns.
Stablecoins All Exchanges Reserve Achieves New ATH
As pointed out by a CryptoQuant post, the all exchanges stablecoins reserve has spiked up and reached a new ATH. Past pattern of the indicator might help predict how Bitcoin’s price will move next.
The all exchanges stablecoins reserve is a metric that measures the amount of stablecoins present on all centralized exchanges.
When the value of this indicator goes up, it means more stablecoins are being sent to exchanges for buying other coins like Bitcoin, or investors are withdrawing from volatile markets into fiat.
A downtrend in the stablecoins reserve would imply these coins are being transferred to personal wallets or being converted to other crypto like BTC.
Related Reading | Despite Drop To $47k, Coinbase Observes 31k Bitcoin Outflow. Bull Rally Still On?
Now, here is a chart that will reveal how the all exchanges stablecoins reserve lines up against the BTC price:
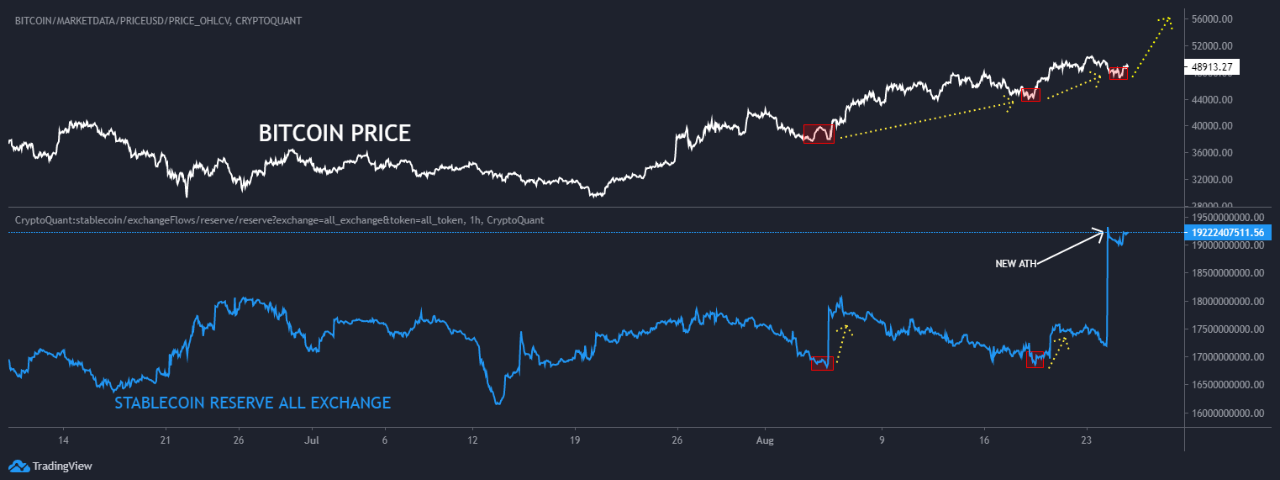
The all exchanges stablecoins reserve shoots up | Source: CryptoQuant
On examining the above graph, two interesting features become apparent. The first one is that the stablecoins supply seems to shoot up when Bitcoin’s price hits a bottom.
The behavior makes sense as keen investors would want to change their positions in the market in reflection to the downtrend in the price.
Related Reading | Puell Multiple: The Bitcoin Metric That Says BTC Miners Aren’t Ready To Sell
The other feature is that soon after the spike happens, the stablecoins reserve starts declining and BTC’s price starts moving up.
This trend has happened twice so far in this month. If it’s indeed a pattern, then Bitcoin’s price should move up now, at least in the short-term, as the indicator is showing a huge spike at the moment.
BTC Price
At the time of writing, Bitcoin’s price is around $46.9k, up 2.5% in the last 7 days. Over the past month, the cryptocurrency has accumulated 22.8% in gains.
The below chart showcases the trend in the price of BTC over the last 5 days:
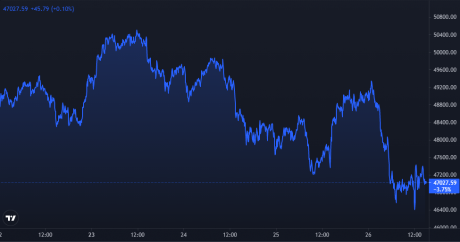
Bitcoin's price continues to fall downwards | Source: BTCUSD on TradingView
Yesterday, BTC started a very sharp uptrend as the cryptocurrency went from $47k to $49k by earlier today. However, soon after that the crypto sharply dropped in price before it could retest the $50k level. This time. the value touched down to as far below as $46k.
The price action would suggest at least a short-term bear market, but if the stablecoins reserve pattern holds true, Bitcoin’s value could soon lift up as investors use these fiat-tied coins to buy the BTC dip.
Featured image from Unsplash.com, charts from CryptoQuant.com, TradingView.com


