

2 years after John McAfee’s death, widow Janice is broke and needs answers – Cointelegraph Magazine
November 8, 2023
AI Eye – Cointelegraph Magazine
November 9, 2023
As November unfolds, the Shiba Inu price action hangs in the balance, with technical analysis revealing a battleground of resistance and support levels that could determine the direction of the meme coin in the coming weeks. However, the bullish indicators are currently strong and could point to a continuation of the rally in the short term.
Shiba Inu Price Analysis: Weekly Chart
The SHIB/USD weekly chart illustrates a dynamic struggle between bullish and bearish forces. A quadruple bottom pattern, evident at support levels labeled 1, 2, 3, and 4, demonstrates a consistent rebound within a two-week timeframe. This pattern signifies a resolute defense by the bulls, offering a signal that indicates a solid base in the range of $0.000006 to $0.000007.
In contrast, the descending triangle pattern poses a bearish threat. The flat support line at $0.00000715 and the sloping blue trend line connecting lower highs depict a narrowing field for the bulls, suggesting a potential decrease in buying momentum. The volume profile supports this, with notable declines accompanying the touches of the descending trend line.
After rising above the 20-week EMA (red line), SHIB is facing the 0.236 Fib level at $0.00000878. Overcoming this resistance is pivotal for SHIB to assert bullish dominance and attempt to break the descending trend line just above $0.00000900. A successful breach could see the price aim for the 50-week EMA at $0.0000985 and subsequently the 0.382 Fib level at $0.00001051, a move that would signify a substantial reversal from the prevailing downtrend in the long-term price chart.
Notably, the EMAs on the weekly chart indicate a still bearish sentiment with the longer-term moving averages positioned above the shorter-term ones, hinting at a sustained bearish trend. However, the recent price uptick could indicate an early sign of a shift in momentum if sustained.
Daily Chart Insights
The daily chart offers a more granular view of SHIB’s recent price action. The 20-day EMA has crossed above the 50 and 100-day EMAs, a bullish sign that could foresee further upside. The daily RSI is also on an uptrend, which aligns with the current bullish narrative, suggesting there is room for upward movement in November.
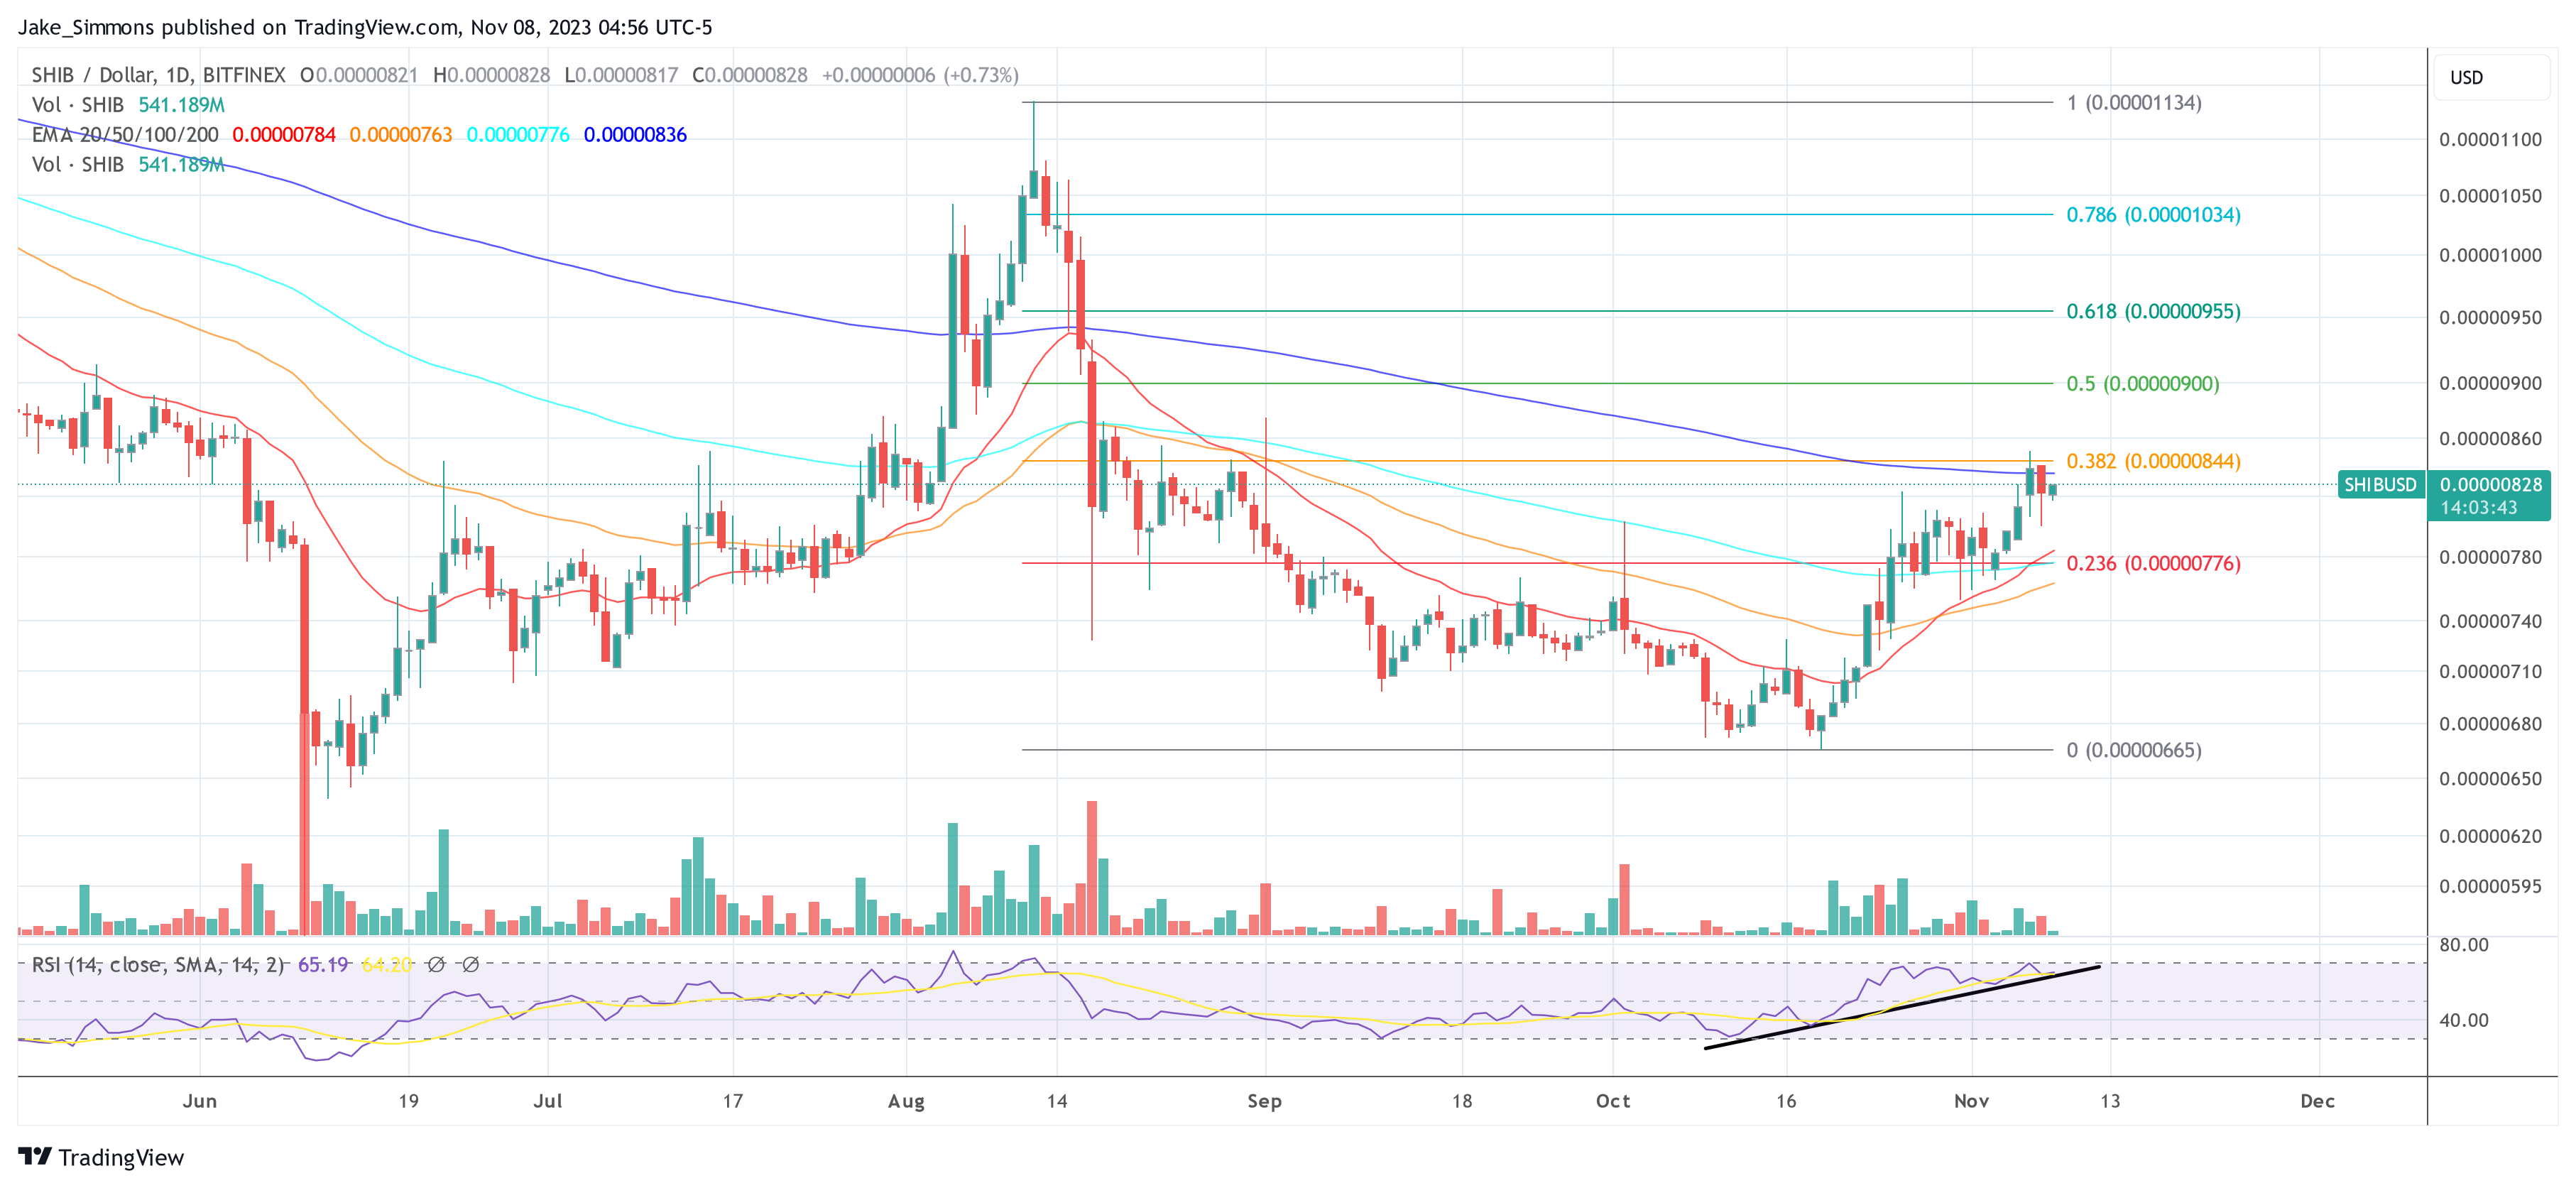
However, a recent rejection at the 0.382 Fib level ($0.00000844) and a slip below the 200-day EMA ($0.00000836) at the beginning of the week introduced caution into the bullish case. The 200-day EMA, a critical long-term indicator of momentum, has historically acted as a decisive pivot point for SHIB.
The price fluctuation around this line and subsequent tests of the descending trend line underscore its significance. A breach above the 200-day EMA could signal the start of a rally, potentially propelling SHIB by an estimated 13% towards the overhead resistance posed by the descending trend line.
Currently, SHIB is trading slightly below the 200-EMA. Remarkably, SHIB attacked the trend line of the ascending triangle (blue line) pattern in the weekly chart each time it surpassed the 200-day EMA. Notable is also that this always happened within one week.
Thus, the 200-day EMA seems to be the most crucial resistance in the short term. If Shiba Inu breaks above the indicator, the price could rally approximately 13% to the blue trend line of the ascending triangle pattern.
Afterward, the Shiba Inu price could then make its ninth attempt in the last 15 months to break out of the gigantic triangle pattern. This will be another make-or-break moment for SHIB, either massive bullish momentum is unleashed or the Shiba Inu price could fall again toward the neckline of the descending triangle at $0.00000715.
Featured image from Crypto.com, chart from TradingView.com


