

VIDYA’s Public Sale Marks the Dawn of a New Blockchain Gaming Era
September 23, 2020
Venezuela Passes Law Legalizing Crypto Mining, Forces Miners to Join National Mining Pool
September 24, 2020
Ripple is down 5% and it broke the key $0.2300 support zone against the US Dollar. XRP price tested the next major support at $0.2200 and it is currently struggling to recover higher.
- Ripple remained in a bearish zone and broke the key $0.2300 support against the US dollar.
- The price is testing the $0.2200 support trading well below the 100 hourly simple moving average.
- There is a major bearish trend line forming with resistance near $0.2315 on the hourly chart of the XRP/USD pair (data source from Kraken).
- The pair could nosedive below the key $0.2200 support if it struggles to recover above $0.2320.
Ripple Price Testing Key Support
Yesterday, we discussed the chances of a sharp decline in ripple below $0.2300. XRP price failed to recover above the $0.2400 resistance and started a fresh decline below the key $0.2300 support level.
It declined 5% and traded below the $0.2250 support. It even spiked below $0.2200 and settled well below the 100 hourly simple moving average. A new weekly low is formed near the $0.2195 level and the price is now consolidating losses.
It is testing the 23.6% Fib retracement level of the recent decline from the $0.2351 high to $0.2195 low. On the upside, an initial resistance for the bulls is near the $0.2280 level.
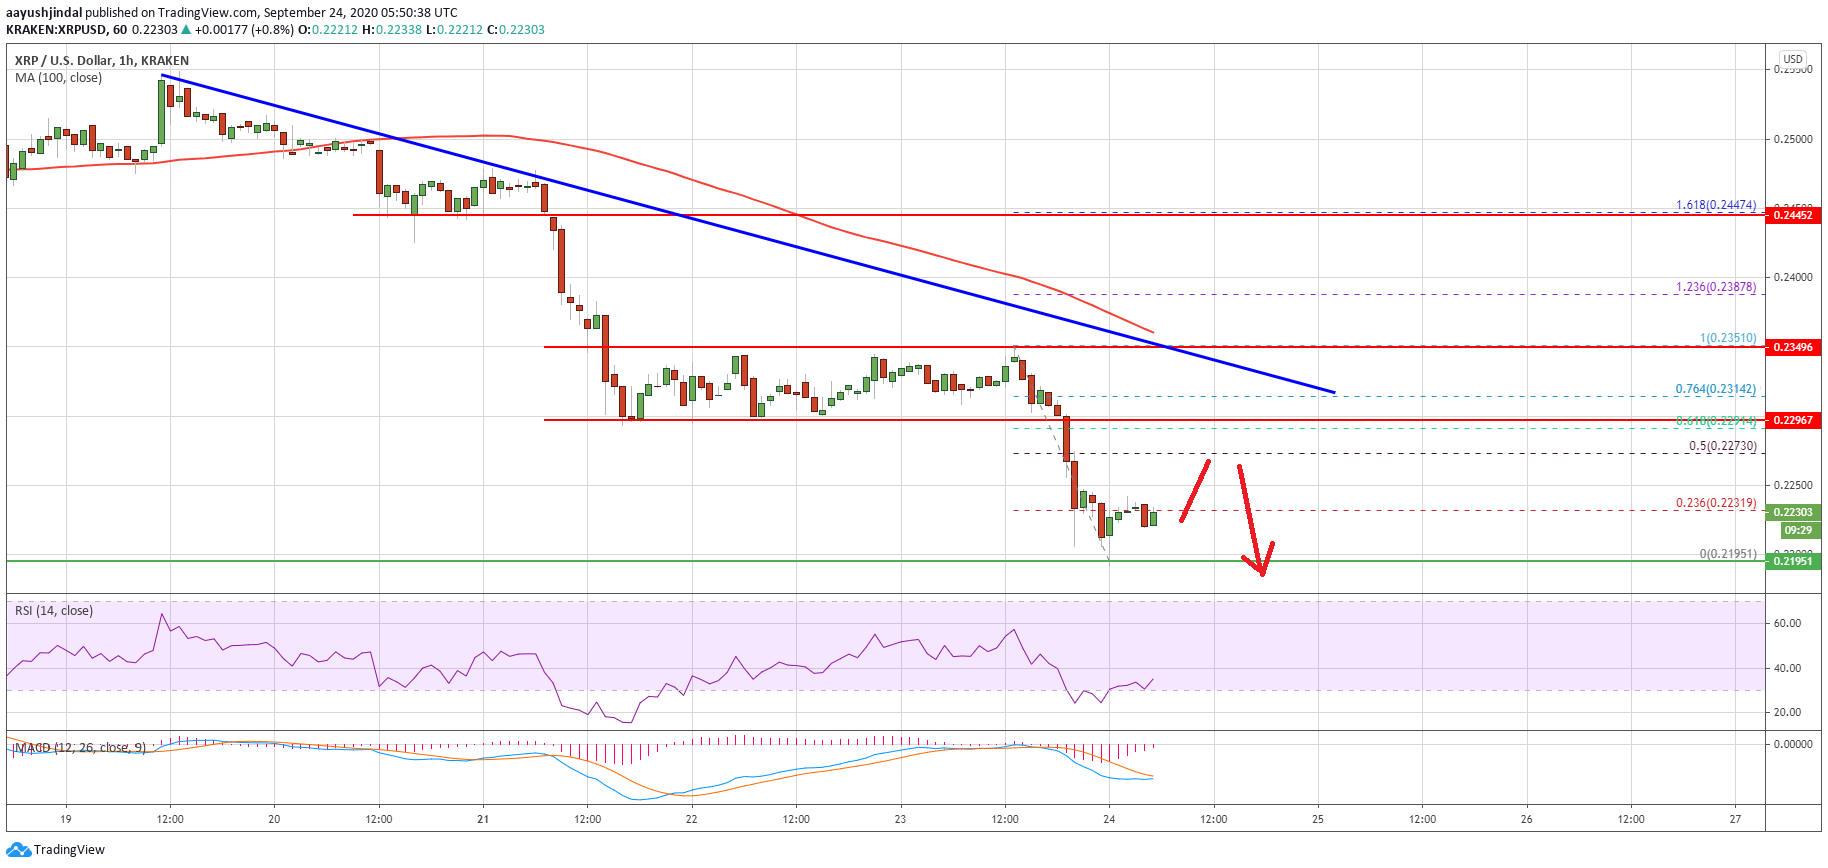
Ripple price dives below $0.2250. Source: TradingView.com
The 50% Fib retracement level of the recent decline from the $0.2351 high to $0.2195 low is also near the $0.2280 level. The main resistance is now near the $0.2300 level (the recent breakdown zone). There is also a major bearish trend line forming with resistance near $0.2315 on the hourly chart of the XRP/USD pair.
To start a strong recovery wave, the price must surpass the $0.2300 and $0.2320 resistance levels. The next key resistance is near the $0.2350 level and the 100 hourly simple moving average.
More Losses in XRP?
If ripple fails to recover above the $0.2280 and $0.2300 resistance levels, there are chances of more losses. The key support for the bulls is near the $0.2200 level.
A clear break below the $0.2200 support zone might spark another nasty decline. The next major support could be near the $0.2120 level, where the bulls are likely to appear.
Technical Indicators
Hourly MACD – The MACD for XRP/USD is slowly moving into the bullish zone.
Hourly RSI (Relative Strength Index) – The RSI for XRP/USD is currently correcting higher towards the 40 level.
Major Support Levels – $0.2210, $0.2200 and $0.2120.
Major Resistance Levels – $0.2280, $0.2300 and $0.2320.


