
RockX launches $20 million investment program for the Polkadot ecosystem
September 23, 2020
VIDYA’s Public Sale Marks the Dawn of a New Blockchain Gaming Era
September 23, 2020
Ripple failed to extend gains above $0.2580 and declined sharply against the US Dollar. XRP price is likely to decline heavily if it breaks the key $0.2300 support zone.
- Ripple is now trading well below the $0.2400 and $0.2380 support levels against the US dollar.
- The price is facing many hurdles and it is now well below the 100 simple moving average (4-hours).
- There was a break below a crucial bullish trend line with support near $0.2440 on the 4-hours chart of the XRP/USD pair (data source from Kraken).
- The pair is likely to decline sharply if there is a close below $0.2300 and $0.2280.
Ripple Price is Testing Important Support
This week, we saw a fresh decline in bitcoin, Ethereum, and ripple. XRP price failed to stay above the $0.2500 and $0.2450 support levels, and moved into a bearish zone.
There was a sharp decline after there was a close below the $0.2440 support and 100 simple moving average (4-hours). More importantly, there was a break below a crucial bullish trend line with support near $0.2440 on the 4-hours chart of the XRP/USD pair.
The pair even traded below the $0.2320 support and traded as low as $0.2293. It is currently consolidating losses above a significant support zone near $0.2290-$0.2300.
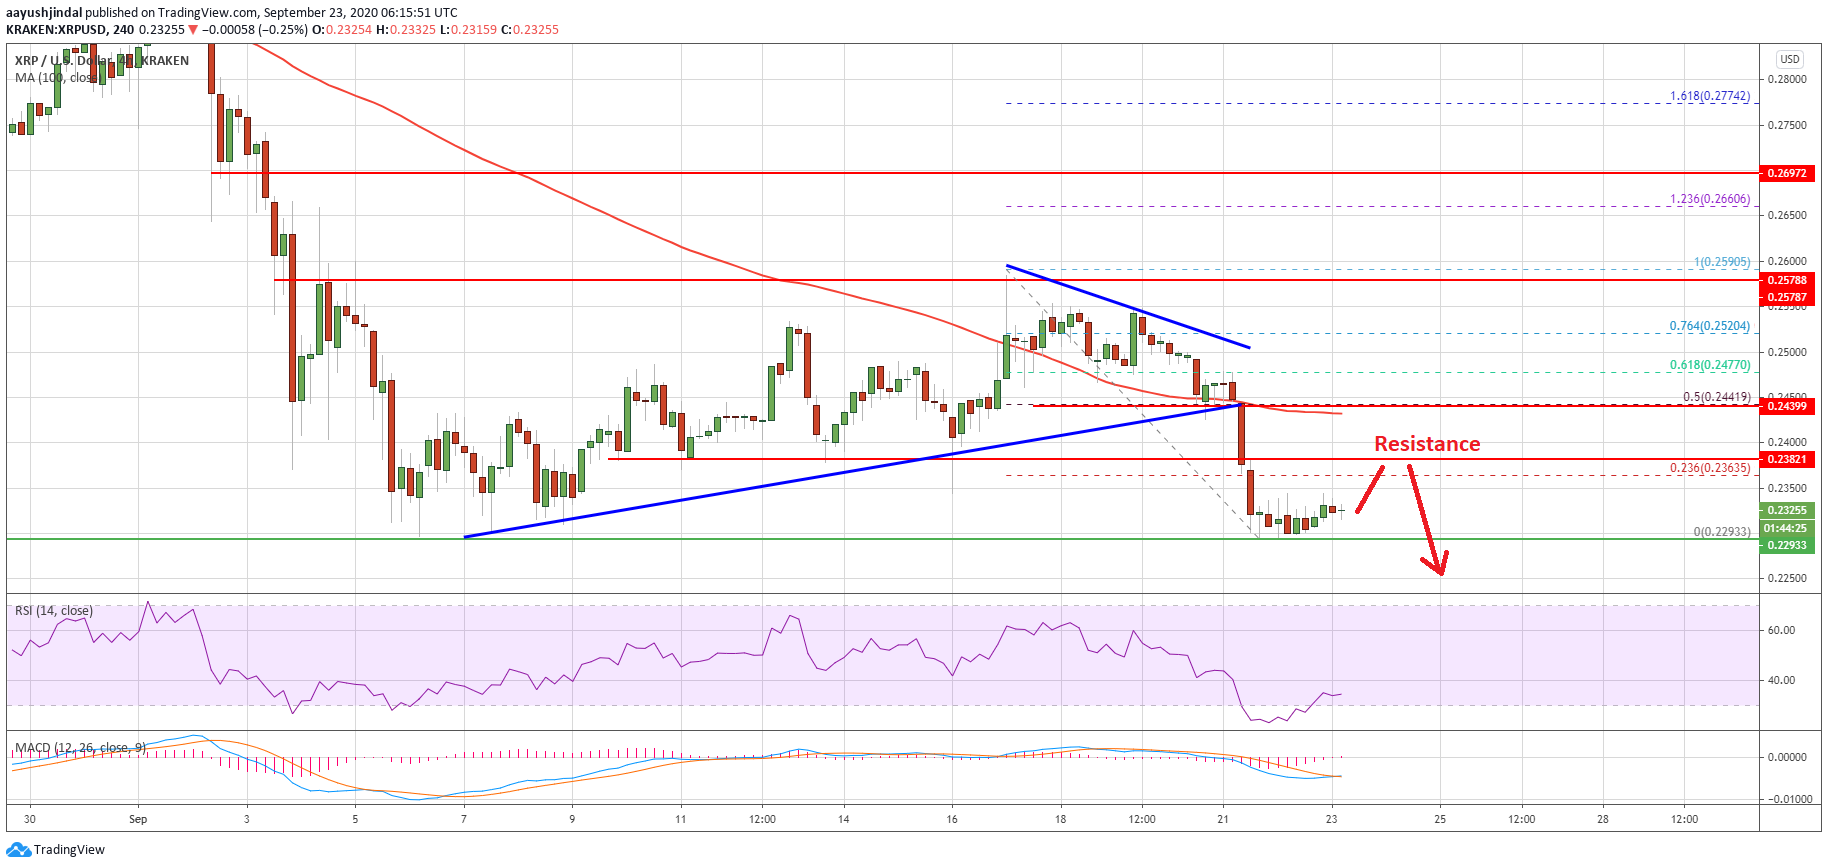
Ripple (XRP) price trades below $0.2350. Source: TradingView.com
On the upside, an initial resistance is near the $0.2360 level or the 23.6% Fib retracement level of the recent decline from the $0.2590 swing high to $0.2293 low. The main resistance is near the $0.2440 level (the recent breakdown zone) and the 100 simple moving average (4-hours).
The 50% Fib retracement level of the recent decline from the $0.2590 swing high to $0.2293 low is also near the $0.2440 level. A successful close above the $0.2440 resistance and the 100 SMA is must for a decent upward move in the near term.
More Losses in XRP?
If ripple fails to recover above the $0.2400 and $0.2440 resistance levels, there is a risk of more losses. The main breakdown support is forming near the $0.2290-$0.2300 zone.
A downside break and close below the $0.2290-$0.2300 zone could start a sharp decline. The next main support is near the $0.2200 level, below which the price could accelerate lower towards $0.2120.
Technical Indicators
4-Hours MACD – The MACD for XRP/USD is slowly losing pace in the bearish zone.
4-Hours RSI (Relative Strength Index) – The RSI for XRP/USD is well below the 50 level.
Major Support Levels – $0.2300, $0.2290 and $0.2200.
Major Resistance Levels – $0.2365, $0.2400 and $0.2440.


