

Tezos improves DeFi infrastructure with Harbinger price oracles
August 26, 2020
Fall Guys Will ‘Die Real Quick’, Says Shroud
August 26, 2020
Ripple is declining and it broke the $0.2800 support zone against the US Dollar. XRP price is currently correcting higher, but upsides are likely to remain capped near $0.2810.
- Ripple is slowly moving into a bearish zone below the $0.2800 support zone against the US dollar.
- The price traded as low as $0.2704 and it is currently correcting higher.
- There is a major bearish trend line forming with resistance near $0.2810 on the hourly chart of the XRP/USD pair (data source from Kraken).
- The pair is likely to move down unless the bulls are able to push the price above the $0.2940 resistance.
Ripple Price Under Pressure
Ripple price started a steady decline from well above the $0.2920 pivot level. XRP even broke the key $0.2850 support level and the 100 hourly simple moving average to move into a bearish zone.
The decline gained pace below the $0.2800 level and the price almost tested the $0.2700 level. A low is formed near $0.2704 and the price is currently correcting higher. It surpassed above the $0.2750 level. There was a break above the 23.6% Fib retracement level of the recent decline from the $0.2920 high to $0.2704 low.
The price is now facing a strong resistance near the $0.2800 level. There is also a major bearish trend line forming with resistance near $0.2810 on the hourly chart of the XRP/USD pair.
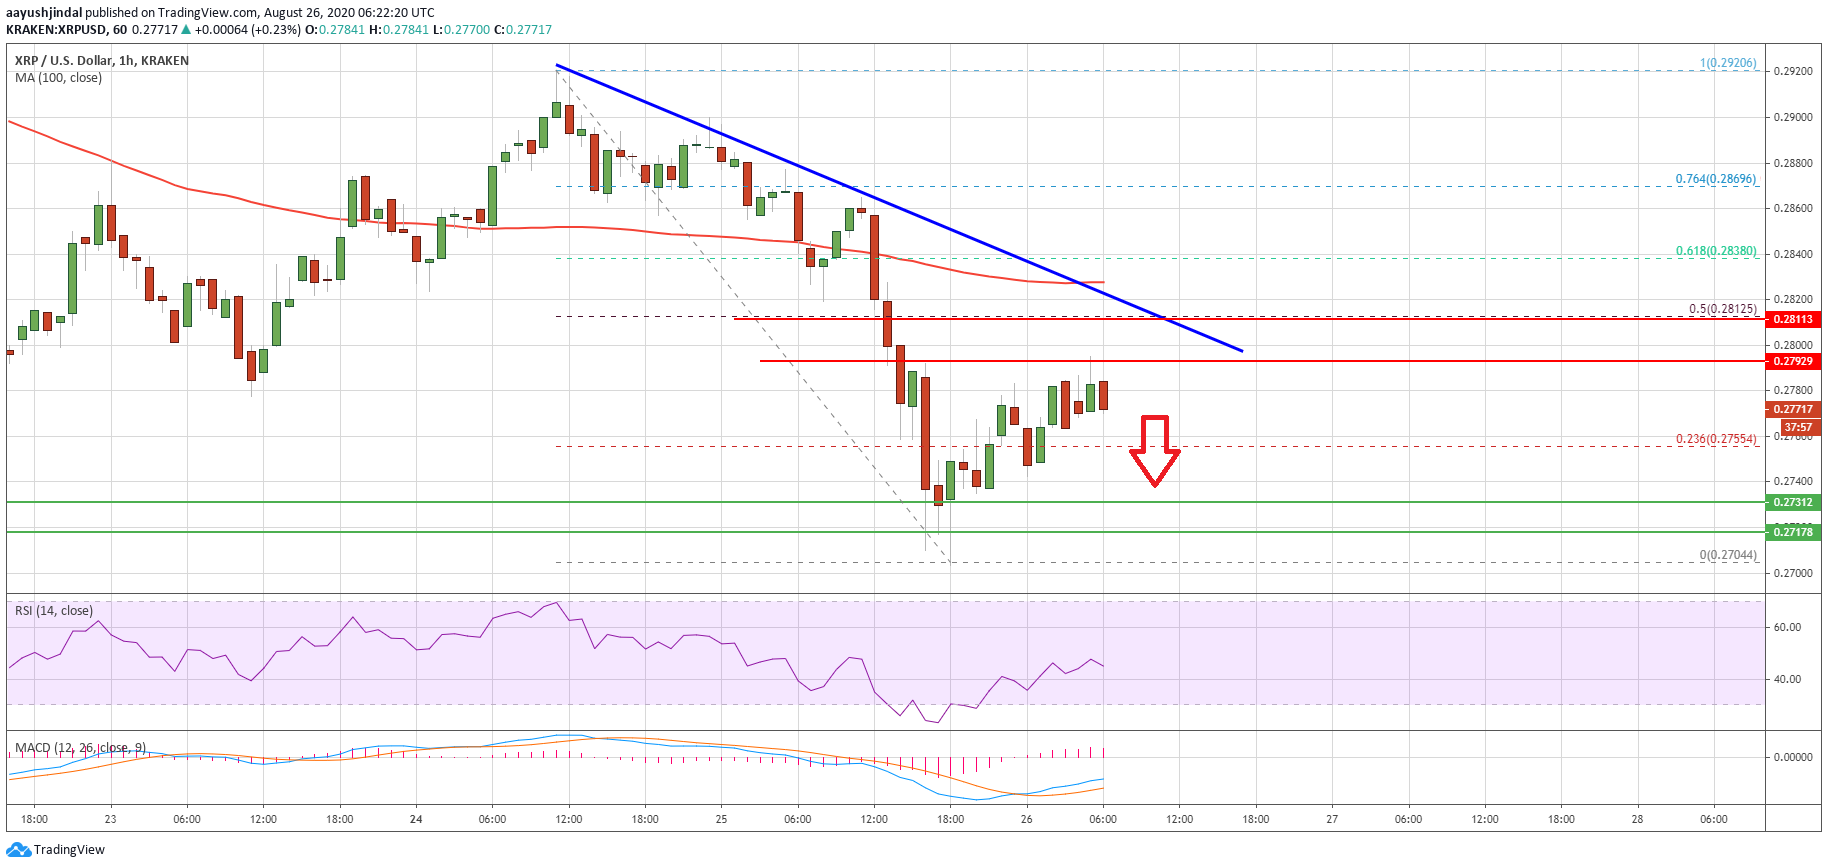
Ripple price trades below $0.2800. Source: TradingView.com
The trend line is close to the 50% Fib retracement level of the recent decline from the $0.2920 high to $0.2704 low. The 100 hourly SMA is also close to the $0.2840 level to act as a key hurdle.
XRP price must surpass the trend line resistance, 100 hourly SMA, and the $0.2840 level to move into a positive zone. In the stated case, the bulls might gain strength for a push towards $0.3000.
More Downsides in XRP?
If ripple struggles to clear above the $0.2800 and $0.2840 resistance levels, there could be more downsides. An initial support is near the $0.2730 region.
The next major support is near the $0.2700 level, below which the bulls are likely to struggle and the price might continue to move down towards the $0.2620 support.
Technical Indicators
Hourly MACD – The MACD for XRP/USD is slowly moving in the bullish zone.
Hourly RSI (Relative Strength Index) – The RSI for XRP/USD is retreating from the 50 level.
Major Support Levels – $0.2730, $0.2700 and $0.2620.
Major Resistance Levels – $0.2800, $0.2840 and $0.2850.


