

Block.One to Launch Social Media Platform Ahead of Schedule
June 8, 2020
Bitcoin Mining and China: Everything You Need to Know
June 8, 2020
Bitcoin may be down 50% from its all-time highs, but Ethereum has registered an even more harrowing performance. Even after rallying approximately 175% from the March lows, the asset remains more than 80% below its all-time high of $1,430.
Some have remarked that the asset’s inability to recover is a death knell for Ethereum bulls, but a top analyst suggests that ETH still has the opportunity to see some considerable upside.
Ethereum Is Poised to Erupt Higher: Ichimoku Cloud Analysis
According to Brave New Coin analyst Josh Olsewicz, Ethereum’s one-week chart is flashing signs it wants to rally 200% towards $750 in the coming months.
He shared the chart below, which indicates that ETH has entered into the key Ichimoku Cloud resistance that is shaded in red. Referencing how the asset is likely to rally to the other end of the resistance in a so-called “end-to-end move,” Olszewicz remarked:
“One-week Ethereum chart. End to end to $750 triggers within the next few months probably.”
Chart of Ethereum’s macro price action from Brave New Coin analyst Josh Olszewicz.
Related Reading: Textbook Wyckoff Analysis Shows Bitcoin Is About to See a Brutal Drop to $7,000s
Positive Catalysts for Ethereum Galore
Backing the positive technicals are fundamentals, which are in favor of Ethereum bulls, analysts have said.
Ryan Watkins, a research analyst at crypto data firm Messari, recently said:
“In short, Ethereum is being used more than ever, and in just two years, Ethereum has evolved from a blank canvas to an agglomeration of novel forms of value and use cases.”
The increasing usage of the underlying blockchain is positive for ETH because according to analyses, the transaction fees that Ethereum miners receive are closely linked to the movement of the cryptocurrency.
If Ethereum usage spikes, so too does the underlying asset.
Related Reading: Crypto Tidbits: $200M of Bitcoin Liquidated, Ethereum DeFi Adoption Limited, Bloomberg Is Bullish
Bitcoin Is Also Bullish
Notably, analysts are also growing bullish on Bitcoin. This should aid Ethereum as the leading altcoin and BTC are closely linked, with rallies in one helping the other.
As reported by NewsBTC previously, Bitfinex’s order book data is showing that there is clear support at $9,500. This is important as order book data has been critical in predicting swings in the price of the cryptocurrency over the past few years.
The chart below illustrates this. The order book data supported Bitcoin when it was trading in the $4,000s in March, while it also nailed the $10,500 highs seen over the past few weeks.
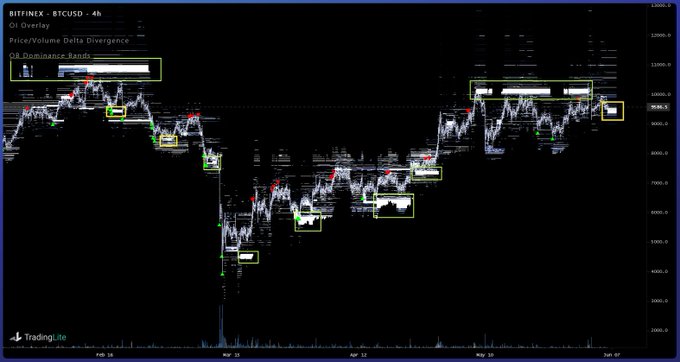
Bitcoin price chart with OB Dominance Bands indicator shared by crypto trader Coiner-Yadox (@Yodaskk on Twitter). The chart is new.
Adding to the bullish sentiment that analysts have on Bitcoin (and thus Ethereum), a trader that predicted the crypto market would see a V-shaped bottom on the day BTC crashed to $3,700 recently said that there’s a fractal predicting the asset trades at $14,000 in the next six weeks.
“Scary fitting fractal from EO 2016 Cut of the top part to not trigger anyone If we see anything like it… inverse capitulation becomes real,” he remarked in reference to the chart below and how crypto investors are expecting “capitulation.”
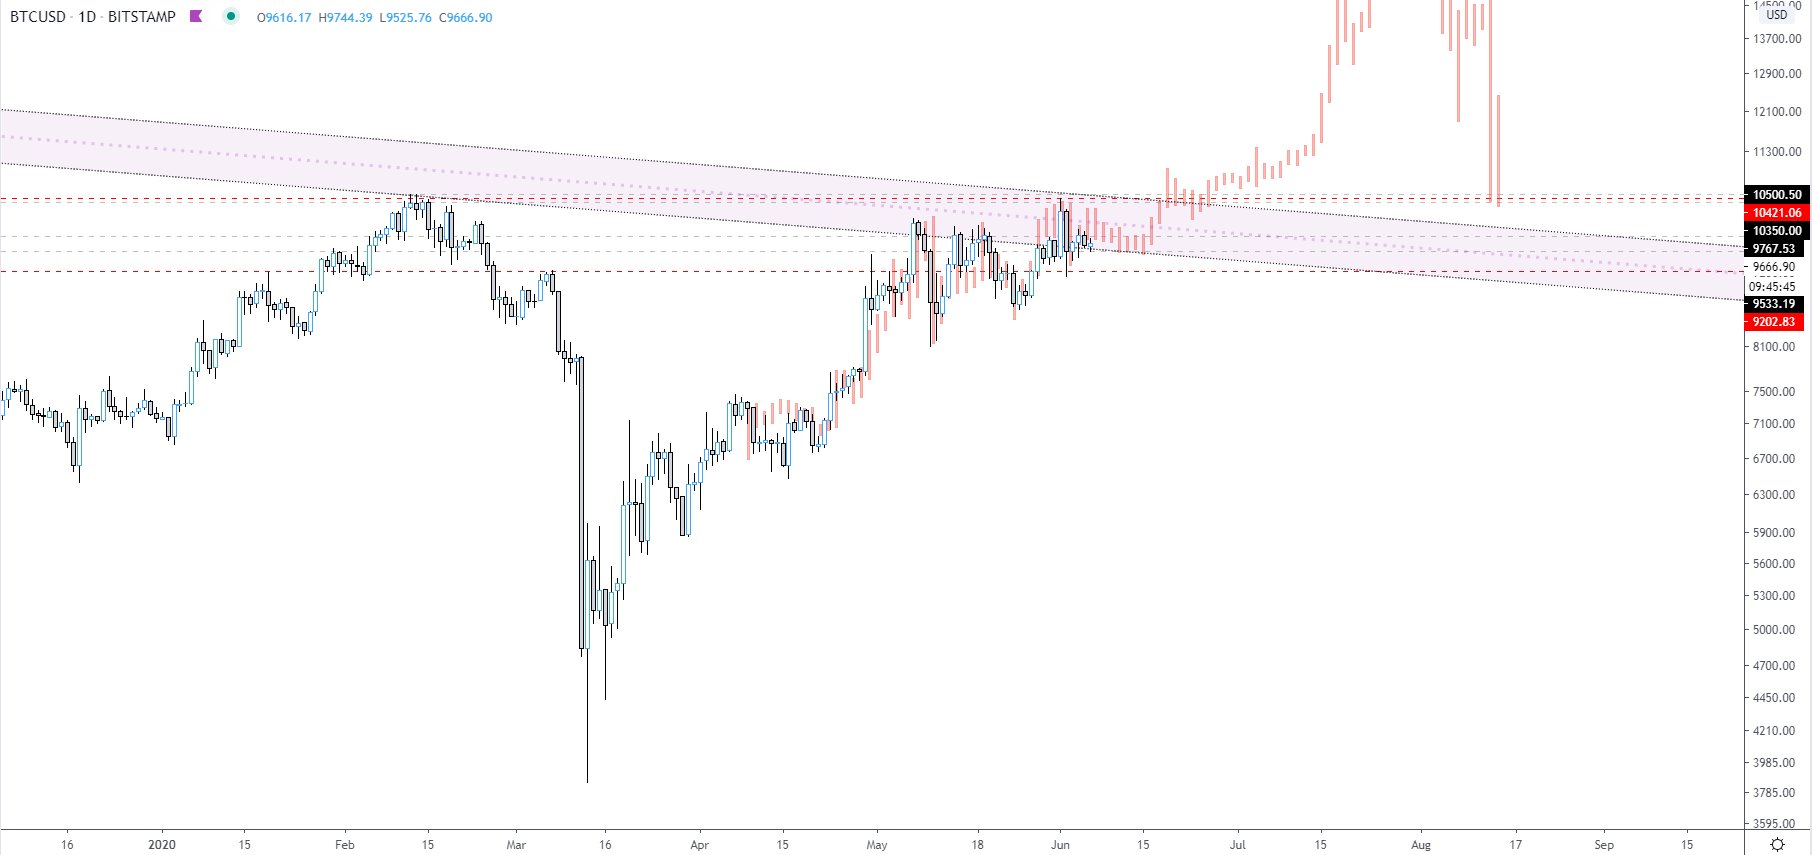
Bitcoin fractal chart shared by cryptocurrency trader Ethereum Jack (@BTC_JackSparrow on Twitter).
Featured Image from Shutterstock
Price tags: ethusd, ethbtc
Ethereum Is Poised to Erupt 200% to $750, According to Crucial Indicator


