

Thailand’s Largest Bank Snubs Ripple – Selects Stellar-based Blockchain for Cross Border Remittances
December 12, 2020
Bringing digitalization to the business world: A DLT adoption outlook
December 13, 2020
Ethereum is recovering higher from the $535 support zone against the US Dollar. ETH price must surpass $580 to start a strong rally towards $600 and $620 in the near term.
- ETH price found support near $535 and started a steady recovery against the US Dollar.
- The price is currently trading above $560 and the 100 simple moving average (4-hours).
- There is a crucial contracting triangle forming with resistance near $570 on the 4-hours chart of ETH/USD (data feed via Kraken).
- The pair could rise sharply if there is a clear break above $570 and $580.
Ethereum Price is Approaching a Key Breakout
This past week, bitcoin and ethereum saw a downside extension below $18,000 and $550 respectively against the US Dollar. ETH price even spiked below the $540 support and settled below the 100 simple moving average (4-hours).
However, the bulls were able to protect the $530 support zone. A swing low was formed near $535 and the price recently started a steady upward move. There was a clear break above the $550 resistance level.
Ether price also surpassed the 50% Fib retracement level of the downward move from the $578 swing high to $535 swing low. It is now trading near the $570 resistance zone and above the 100 simple moving average (4-hours). There is also a crucial contracting triangle forming with resistance near $570 on the 4-hours chart of ETH/USD.
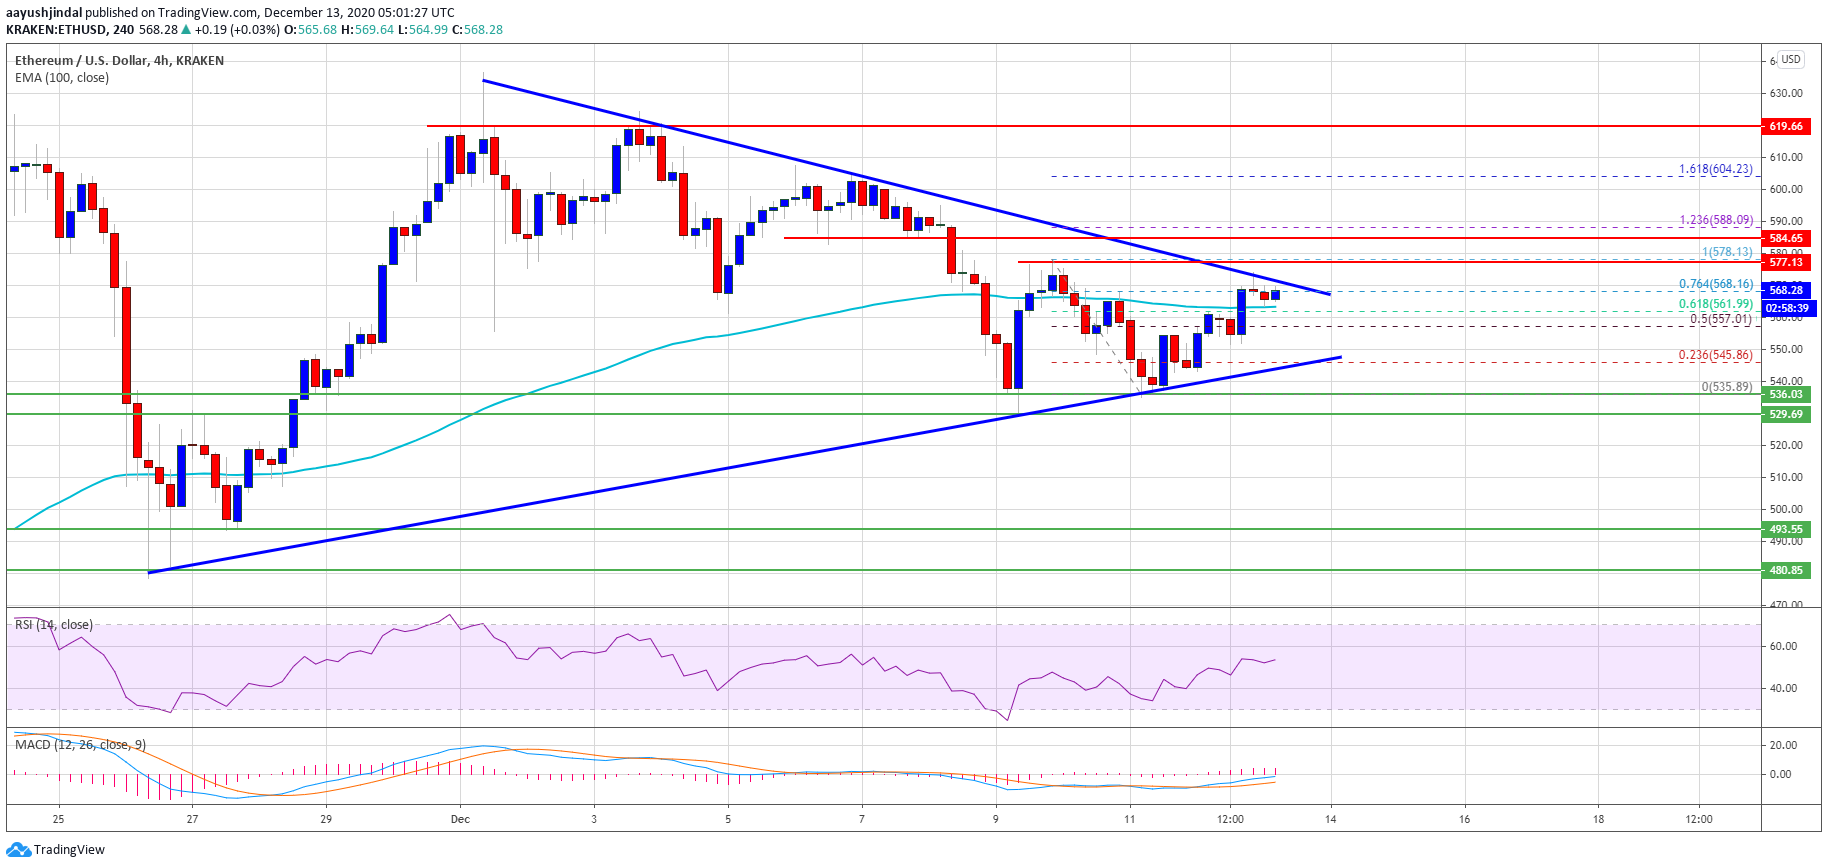
Source: ETHUSD on TradingView.com
The triangle resistance is close to the 76.4% Fib retracement level of the downward move from the $578 swing high to $535 swing low. The next major resistance and a key breakout zone sits near the $580 level.
A successful break above the $570 resistance and a follow up move above the $580 level could start a strong increase. The next major resistance is near $600, above which it could rise towards the $620 level.
Fresh Decline in Ether (ETH)?
If Ethereum fails to clear the $570 and $580 resistance levels, there is a risk of another bearish reaction. An initial support is near the $555 level.
The first major support zone sits near the $550 level and the triangle lower trend line. A downside break below the triangle support might lead the price towards the $535 support zone.
Technical Indicators
4 hours MACD – The MACD for ETH/USD is slowly gaining momentum in the bullish zone.
4 hours RSI – The RSI for ETH/USD is showing positive signs and it is above the 50 level.
Major Support Level – $550
Major Resistance Level – $570


