

Bitmain to Launch Platform for Connecting Miners and Farms in October
September 27, 2019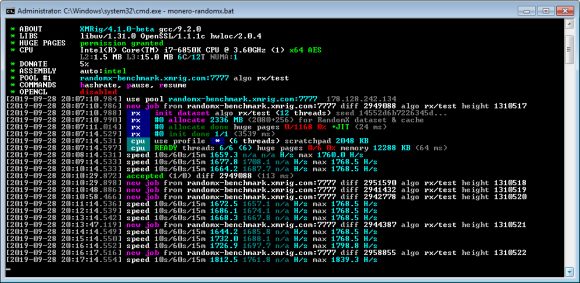
Using XMRig for Mining RandomX, RandomWOW and RandomXL on CPU
September 28, 2019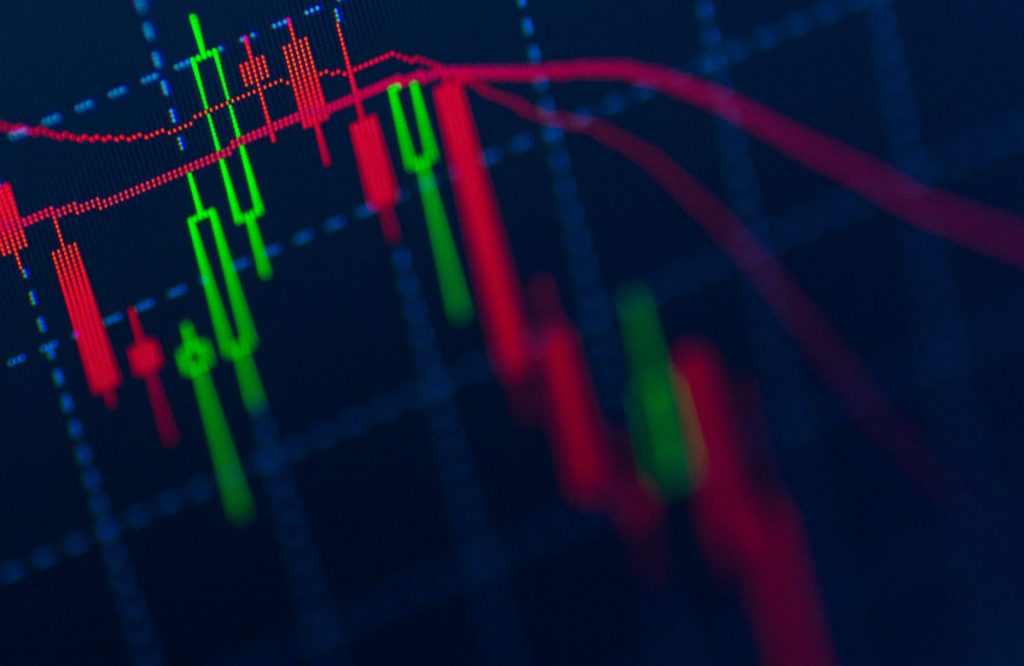
The momentum behind Bitcoin price turned from bullish to bearish this week, when the crypto asset fell through the bottom of a triangle it had been trading inside, plummeting over 20% in value.
The force of the drop took Bitcoin price down far enough where it tested the 200-day moving average as support – a moving average that supported Bitcoin’s entire bull run during 2016 and 2017. But crypto investors’ worst fears have come true, and Bitcoin has now closed a daily candle below the important indicator.
Daily Candle Closes Below 200-Day MA, What’s That Mean for Bitcoin Price?
Moving averages are simply the average of a price within a particular timeframe. Certain moving averages are more effective than others as a trading signal, and typically the longer the timeframe on the moving average, the more significant it can act as support or resistance.
Take the 200-week moving average, for example. At Bitcoin’s bear market bottom, the nearly four-year term moving average acted as support and caused Bitcoin to bounce all the way from $3,100 to $14,000 where this rally came to a screeching halt.
Related Reading | Inverted BTC/USD Chart Is Bear Market Bottom Flipped Upside Down
But despite the nasty rejection at that price level, and a subsequent descending triangle formation, bulls kept faith that Bitcoin would break upward and continue along its bull run. Much of this was based on the idea that Bitcoin price was trading above its 200-day moving average – not to be confused with the aforementioned 200-week moving average that supported Bitcoin’s bottom.
Throughout the entire 2016-2017 bull run – the one that helped put crypto on the map – each correction in Bitcoin price was repeatedly supported by the 200-day moving average, and never closed a daily candle below it.
#bitcoin just had a daily close below the 200 day moving average. First time since the pump to $5k in April. pic.twitter.com/OVCNjnUK35
— Dvir Oren (@cryptodvir) September 27, 2019
But this time is different. Bitcoin price just closed its first daily candle below the 200-day moving average since the April rally first began, and could be a signal that Bitcoin’s bull run is in jeopardy and a return to the bear market may be possible.
Bitcoin price has already breached below $8,000 and the low $7,000 range could be next. Below that, former bear market support in the low $6,000 range would need to hold up and confirm as support for BTC to avoid plunging deeper toward what most believe to be the bear market bottom.
Related Reading | Next Week Could Be Most Critical Week for Crypto Yet
However, the closer it gets to that previous bottom, the higher the chances are that it wasn’t the bottom at all, and BTC could test the $2,000 or even $1,000 range. Such a drop, could potentially spell the end for Bitcoin, as it would cause many to question the longevity of the asset.


