

Japan Implements Significant Changes to Cryptocurrency Regulation Today
May 1, 2020
UK Cryptocurrency Firms Turn to Equity Funding as ICO Coffers Plunge 70%
May 2, 2020
Bitcoin appears to have now entered another bout of consolidation as the cryptocurrency attempts to break into the $9,000 region. This comes as buyers struggle to surmount the heavy selling pressure that has laced the upper $8,000 region.
It seems as though could be on the cusp of seeing a pullback, as one extremely popular technical indicator called the “TD sequential” is signaling that this uptrend is running out of fuel.
This isn’t the only indicator blinking bear-favoring signs, as another historically accurate top indicator just flashed, signaling that some intense downside could be imminent in the days and weeks ahead.
Bitcoin Shrugs Off Yesterday’s Grim Daily Candle Close; Stabilizes in Upper-$8,000 Region
At the time of writing, Bitcoin is trading down marginally at its current price of $8,770. This marks a slight decline from daily highs of $9,200 that were set overnight, and only a minor rebound from lows of roughly $8,700.
The cryptocurrency is now entering a consolidation phase as it struggles to surmount the resistance that laces the region between its current price and $9,000.
The overnight rejection at $9,200 marked the second one that BTC has seen throughout the course of its latest explosive upsurge, and a continued defense of this level from sellers could be enough to force it lower.
It is important to note that this uptrend may be slightly different than those seen in prior months and years, as this one was driven primarily by spot buying pressure.
Typically, margin traders drive explosive movements through the use of leverage, but the massive decline in open interest seen in the time since BTC’s mid-March meltdown has elucidated inactivity amongst this investor base.
Nevertheless, the benchmark cryptocurrency is still showing some signs of weakness due to the massive upwards wick on yesterday’s daily candle leading one historically accurate indicator to flash a short sign.
One popular pseudonymous trader on Twitter offered a chart showing the historical accuracy of the indicator, sarcastically asking “does the halving fix this?”
Image Courtesy of Moon Overlord
Prominent Indicator Signals BTC is Losing Its Momentum
Bitcoin’s TD sequential indicator also offered a similarly gloomy outlook for the cryptocurrency, flashing signs that the recent rally is losing its strength.
Josh Rager – a well-respected analyst – spoke about this in a recent tweet, explaining that he is still cautious about being too bearish until BTC breaks below $8,400.
“Still above support at $8400 – though the ever so popular TD sequential indicator points out possible uptrend exhaustion with pullback soon. I prefer to keep it simple with horizontals, break and close below $8400 and we’ll be seeing $7800,” he noted.
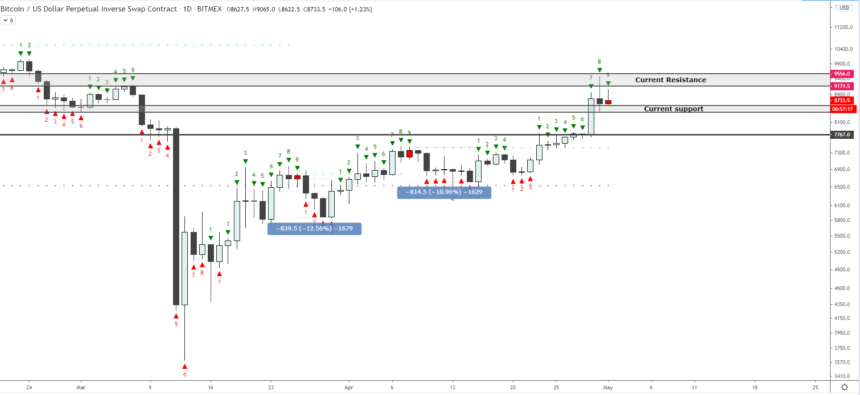
Image Courtesy of Josh Rager
How the crypto trends as its weekly close fast approaches will be critical for determining the long-term significance of this latest upswing.
Featured image from Unplash.


