

Crypto’s ‘pro-rioter’ glitch artist stirs controversy — Patrick Amadon, NFT Creator – Cointelegraph Magazine
November 1, 2023
‘Top 10… brings no satisfaction’ says Polygon’s Sandeep Nailwal – Cointelegraph Magazine
November 2, 2023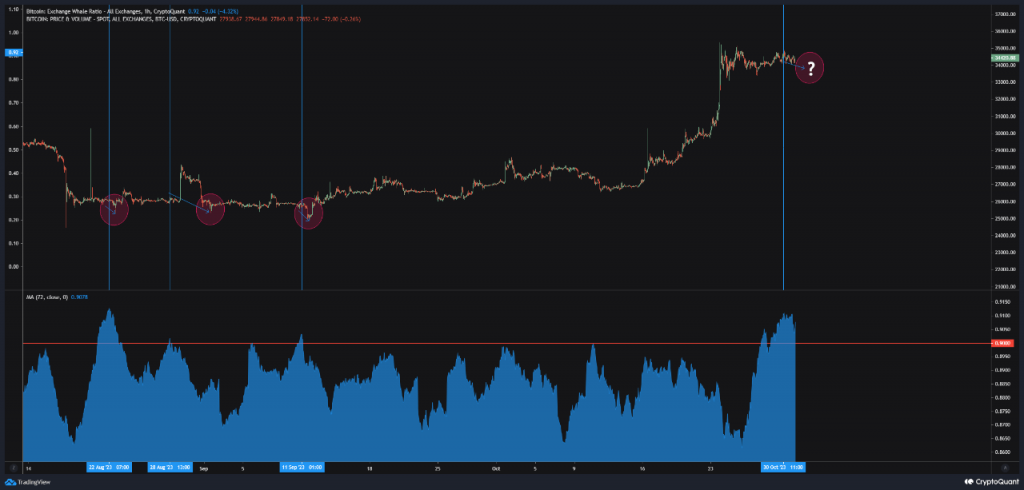
On-chain data shows the Bitcoin whales have potentially ramped up their selling recently, something that could lead to a drawdown for the asset.
Bitcoin Exchange Whale Ratio Has Spiked Recently
As explained by an analyst in a CryptoQuant Quicktake post, the price of Bitcoin could correct towards the $31,000 to $32,000 range from the current whale selling pressure.
The relevant indicator here is the “exchange whale ratio,” which measures the ratio between the sum of the top 10 transfers to exchanges and the total exchange inflow.
The 10 largest transactions going towards these platforms generally come from the whales, so this ratio can tell us about how the inflow activity of the whales currently compares against the rest of the market.
These humongous investors may transfer their coins to these central entities for a variety of purposes, one of which could be for selling. Thus, whenever the whales occupy a large part of the total exchange inflows, it’s a potential sign that the selling pressure being mounted by this cohort is rising.
Historically, the indicator crossing the 0.90 mark has particularly been bearish for the cryptocurrency. At this level, 90% of the total inflows are coming from the wallets of the whales.
Now, here is a chart that shows the trend in the 72-hour moving average (MA) Bitcoin exchange whale ratio over the past few months:
The 72-hour MA value of the metric seems to have gone up in recent days | Source: CryptoQuant
In the above graph, the quant has marked the 0.90 level in red and has highlighted the points in the Bitcoin price corresponding to the instances where the 72-hour MA exchange whale ratio crossed this line.
The analyst notes that in all of these occurrences, the cryptocurrency first registered some volatility and then observed a decline in the short term, leading toward a local bottom formation.
Given the close timings, it would appear possible that the higher inflows from the whales during these instances were at least partially made for selling purposes.
From the chart, it’s visible that the indicator has once again risen above the 0.90 level recently, suggesting that the whales have considerably ramped up their inflows.
Naturally, these high values of the metrics don’t necessarily have to be bearish for the asset, as it’s possible that this cohort is simply opening up positions on the derivatives market this time (and to some extent, it has to be true in either case, as the futures open interest has seen an increase in the last few days).
Given the pattern that has followed in the last few instances, though, the quant says, “I expect increased volatility in Bitcoin and anticipate a new local bottom with a drop to the 31,000 to 32,000 dollar range, which previously acted as resistance.”
BTC Price
Bitcoin hasn’t been able to find any direction in the last few days as the coin has been consolidating above $34,000. If the exchange whale ratio is anything to go by, though, things might change soon for the asset.
Looks like BTC has continued to move sideways recently | Source: BTCUSD on TradingView
Featured image from Rémi Boudousquié on Unsplash.com, charts from TradingView.com, CryptoQuant.com


