

Sichuan Officials Continue to Foster the Relationship Between Bitcoin Mining and Hydropower
August 18, 2020
Fake Tokens Continue to Plague Uniswap
August 19, 2020
Bitcoin price started a downside correction from the $12,500 resistance against the US Dollar. BTC is currently trading below $12,000, but there are many key supports on the downside.
- Bitcoin started a short-term downside correction and traded below the $12,000 support.
- The price is likely to find a strong support near $11,800 or $11,550.
- There is a major bullish trend line forming with support near $11,850 on the hourly chart of the BTC/USD pair (data feed from Kraken).
- The pair might bounce back as long as it is above the $11,550 support level in the coming sessions.
Bitcoin Price Starts Corrective Wave
After a sharp upward move, bitcoin traded close to the $12,500 resistance against the US Dollar. BTC traded as high as $12,491 and recently started a downside correction.
There was a break below the $12,200 support level to start the recent correction. The price even broke the $12,000 support area and the 100 hourly simple moving average. However, the $11,800 level acted as a strong support.
There is also a major bullish trend line forming with support near $11,850 on the hourly chart of the BTC/USD pair. The pair is currently trading near the 23.6% Fib retracement level of the recent decline from the $12,491 high to $11,813 low.
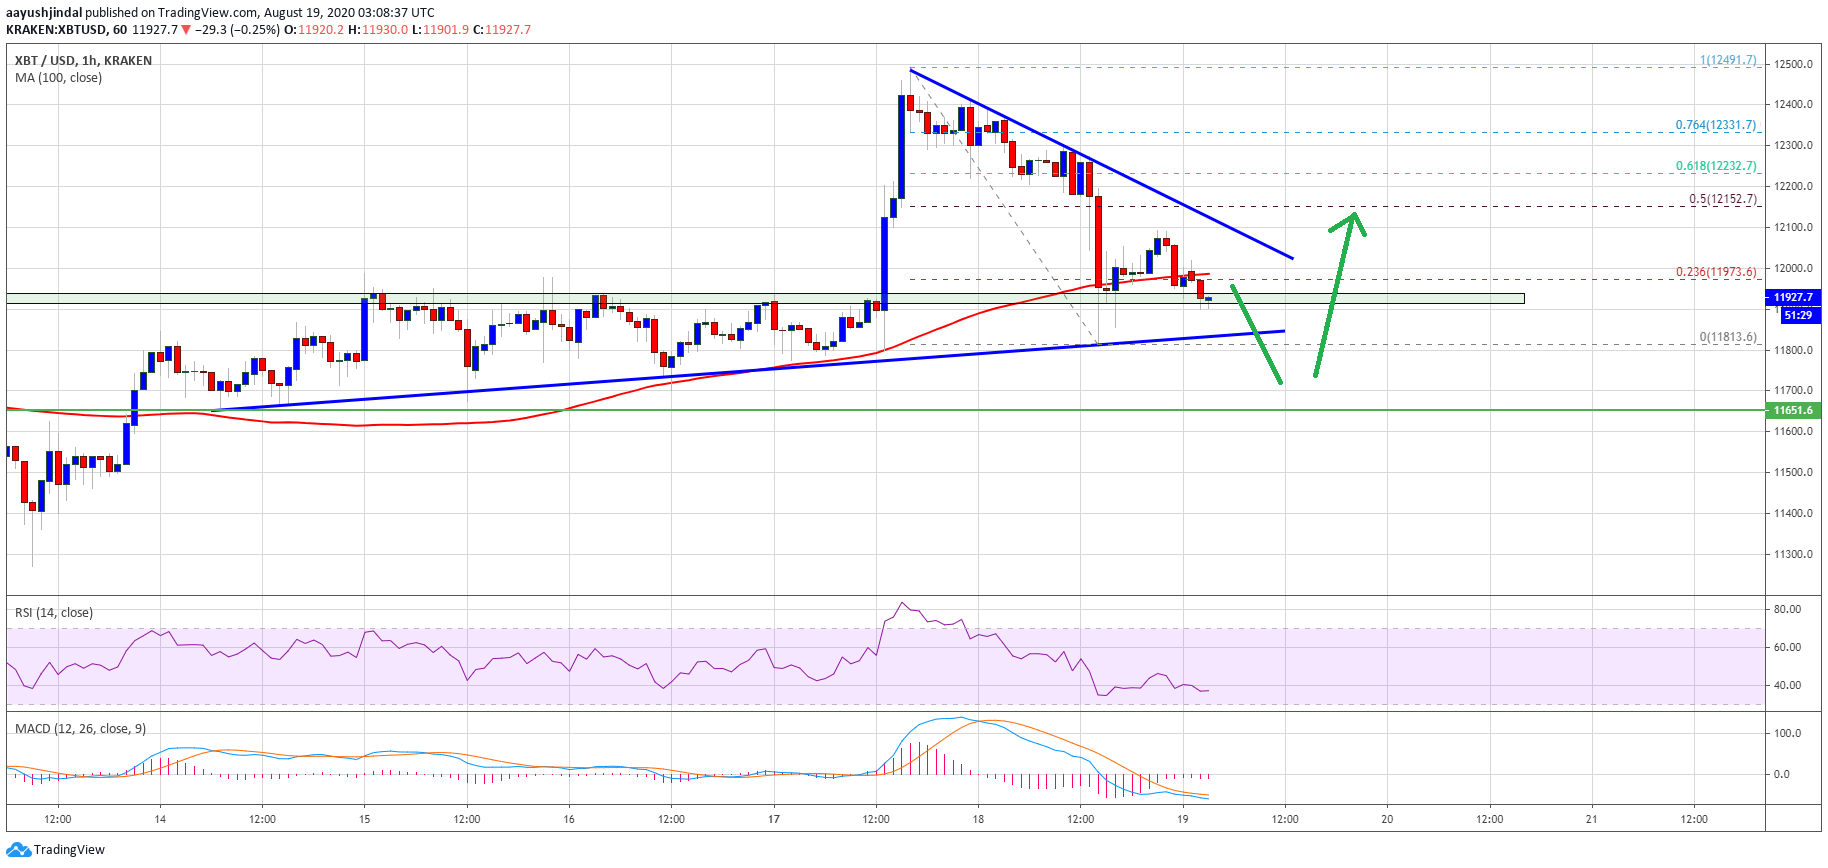
Bitcoin price trades below $12,000. Source: TradingView.com
On the upside, the $12,000 level is a short-term resistance along with the 100 hourly SMA. The next resistance is near the $12,100 level and a connecting bearish trend line on the same chart.
The main resistance is now near the $12,150 level or the 50% Fib retracement level of the recent decline from the $12,491 high to $11,813 low. A successful push above the trend line, $12,150, and $12,200 is must to start a fresh increase in the near term. In the mentioned case, the price might revisit the $12,500 resistance.
Downsides Limited in BTC?
If bitcoin struggles to start a fresh increase above $12,100 and $12,200, it could continue to move down. The first major support is near the $11,800 level.
The next major support is near the $11,650 and $11,550 levels, below which the price bulls are likely to lose control in the coming sessions.
Technical indicators:
Hourly MACD – The MACD is slowly losing momentum in the bearish zone.
Hourly RSI (Relative Strength Index) – The RSI for BTC/USD is now well below the 50 level.
Major Support Levels – $11,800, followed by $11,650.
Major Resistance Levels – $12,100, $12,150 and $12,200.


