
Review: Crypto.com’s Ruby Steel Prepaid Visa Card
June 26, 2020
Even Putin Couldn’t Save This Dark Web Mastermind From Prison
June 26, 2020
Bitcoin started an upside correction after testing the $9,000 support against the US Dollar. BTC is now facing a strong resistance near the $9,300 and $9,400 levels.
- Bitcoin is recovering and it is trading above the $9,200 support level.
- The price is facing a few key hurdles near $9,300, $9,400, and the 100 hourly simple moving average.
- There is a major contracting triangle forming with resistance near $9,330 on the hourly chart of the BTC/USD pair (data feed from Kraken).
- The pair could either climb further above $9,330 or start a fresh decline towards $9,000.
Bitcoin Price Showing Recovery Signs
Yesterday, bitcoin price extended its decline below the $9,200 support against the US Dollar. BTC tested the main $9,000 support level and settled well below the 100 hourly simple moving average.
A new weekly low was formed near $8,991 and recently the price started an upside correction. It recovered above the $9,150 and $9,200 levels to start a decent recovery. Besides, there was a break above the 23.6% Fib retracement level of the downward move from the $9,660 swing high to $8,991 low.
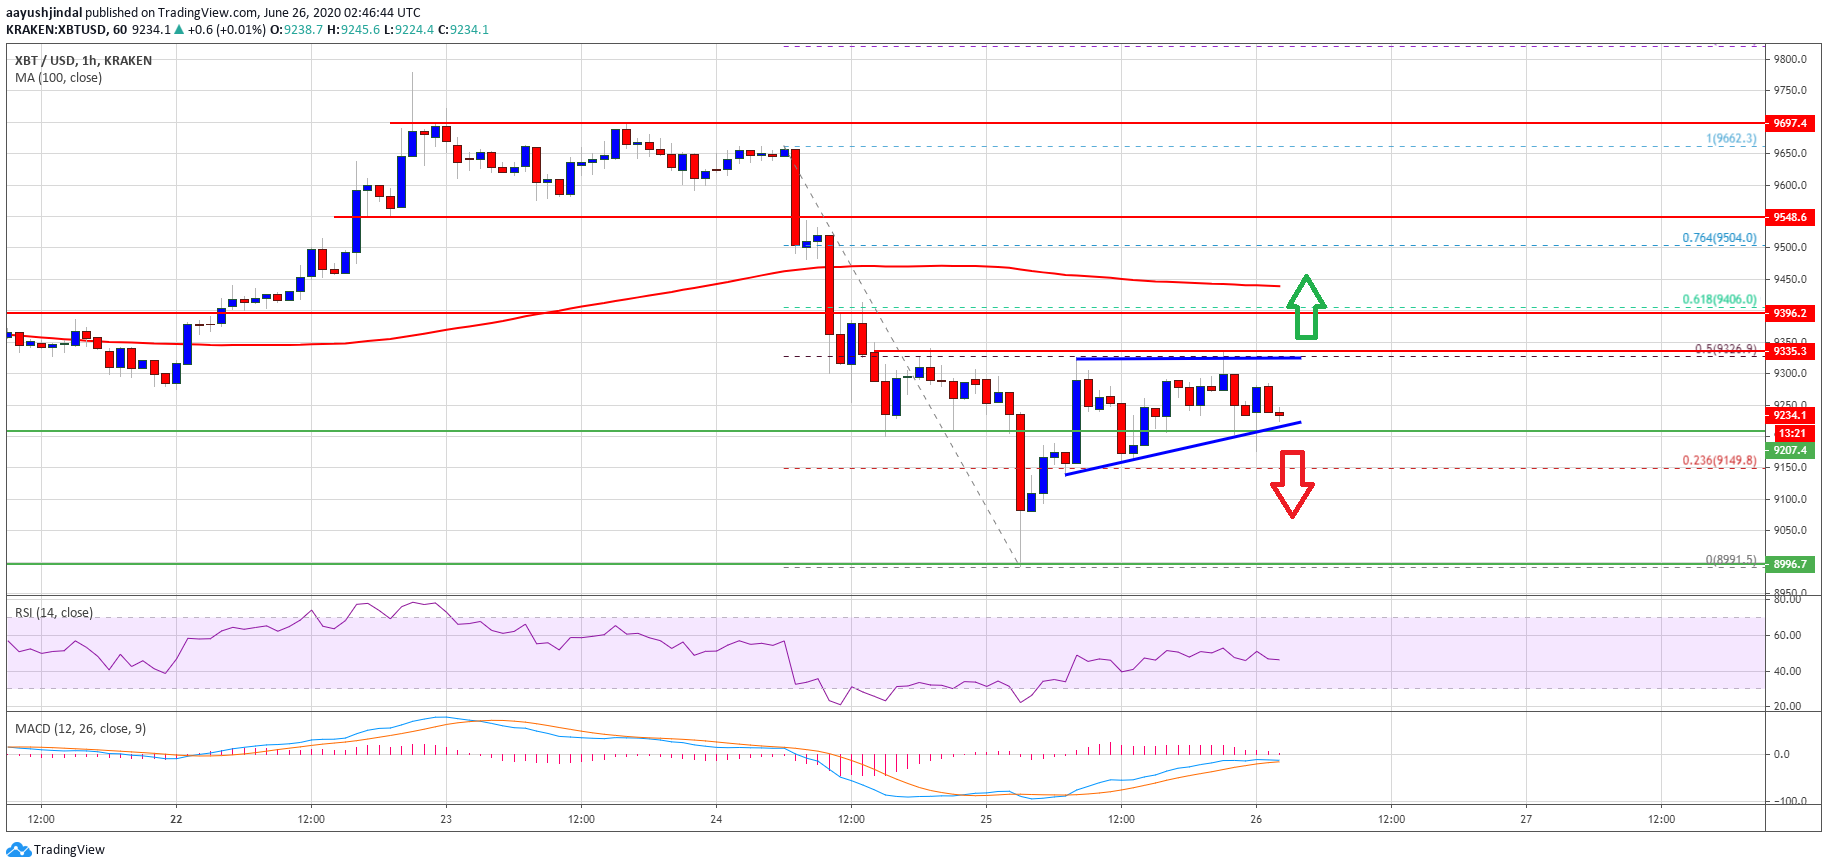
The price is currently trading in a range and consolidating above $9,200. On the upside, an initial resistance is near the $9,300 and $9,330 levels. There is also a major contracting triangle forming with resistance near $9,330 on the hourly chart of the BTC/USD pair.
Bitcoin price trading above $9,200: Source: TradingView.com
The triangle resistance is close to the 50% Fib retracement level of the downward move from the $9,660 swing high to $8,991 low. If bitcoin breaks the $9,300 and $9,330 resistance levels, it could test the next resistance at $9,400.
Any further gains could lead the price towards the 100 hourly SMA or the $9,500 resistance, where the bears are likely to take a stand.
Fresh Decline in BTC
On the other hand, bitcoin price might start a fresh decline if it fails to stay above the triangle support and $9,200. An initial support below the $9,200 level is at $9,150.
The next major support is near the $9,000 level. A successful daily close below the $9,000 support level could open the doors for another sharp decline and the price might dive towards the $8,500 support level in the near term.
Technical indicators:
Hourly MACD – The MACD is slowly moving in the bearish zone.
Hourly RSI (Relative Strength Index) – The RSI for BTC/USD is still below the 50 level.
Major Support Levels – $9,200, followed by $9,000.
Major Resistance Levels – $9,300, $9,330 and $9,400.


