

Will the Real Polygon Please Stand Up — Spammers Wrongly Post Coin Drops on Video Game-Related Feed – News Bitcoin News
August 11, 2021
What the SEC can learn from the German regulator
August 12, 2021
Data shows funding rates for Bitcoin have turned positive, a signal that might indicate market sentiment is bullish among traders.
Bitcoin Funding Rates Turn Positive, While Derivative And Spot Reserves Move Down
As pointed out by a CryptoQuant post, the funding rates seem to be slightly positive for the BTC market right now.
The Bitcoin funding rates are the payment that traders need to pay so that they can keep an open position. This additional, periodic fee is based on the difference between the perpetual contract market and the spot price.
These funding rates are used for perpetual futures contracts by all cryptocurrency derivatives exchanges. When the value is positive, longs have to pay a fee to the shorts. While when it’s negative, the opposite stands true.
Related Reading | Three White Soldiers: The Signal That Shows Bitcoin Bulls Are Preparing For Battle
Because of this, a positive funding rate implies many traders are bullish as they have to pay a premium to keep their positions. In contrast to this, the market sentiment is bearish when the funding rate is negative.
Now, here is a chart that shows the trend in the funding rates for Bitcoin:
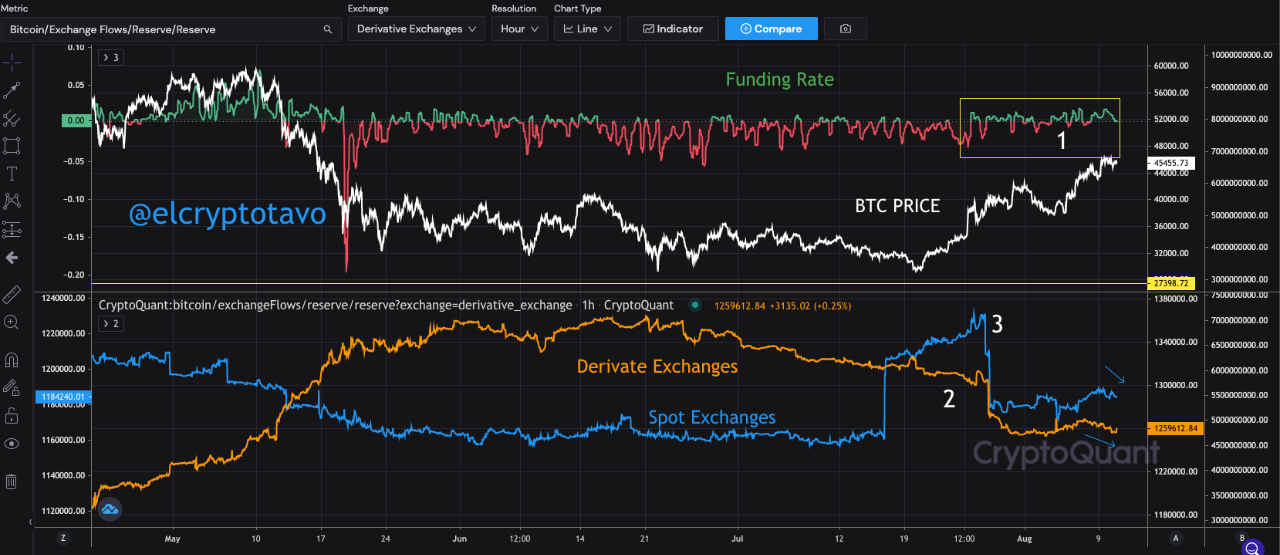
The various indicators seem to be bullish | Source: CryptoQuant
As the above graph shows, the funding rates seem to be slightly positive at the moment. This could indicate there is bullish sentiment among traders right now.
Another thing to notice in the chart is that the funding rates remained green in May when BTC was making new all-time-highs (ATHs), but a negative spike occurred when the price went downhill.
Besides the funding rates, the chart also has two other indicators: the derivatives exchange reserve and the spot exchanges reserve.
Related Reading | Could The New “China Model” Be The Reason The Country Banned Bitcoin Mining?
Both these values also seem to be heading downwards. This could be another bullish sign as it may mean investors want to hodl right now rather than sell.
BTC Price
At the time of writing, Bitcoin’s price is around $46.5k, up almost 18% in the last 7 days. Monthly gains for the cryptocurrency stand at 40%.
The below chart showcases the trends in the price of BTC over the span of the last three months:
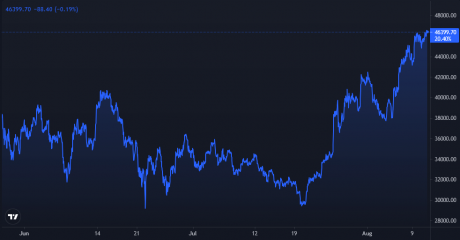
BTC's price continues on the overall upwards trend | Source: BTCUSD on TradingView.com
Bitcoin sets eye on $47k as the coin continues to enjoy a sharp uptrend over the past week. It’s unclear at the moment how long the crypto can keep this trend up. It’s possible BTC could soon start moving down, however, if the funding rates are anything to go by, the sentiment among many traders seems to be bullish at the moment.
Featured image from Unsplash.com, charts from CryptoQuant.com, TradingView.com


