

NFT, Art, Fidenza, Art Blocks, curated, generative art, opensea
September 13, 2021
Elon Musk’s New Puppy Tweet Sends Shiba Floki Token Soaring, FLOKI Jumps More Than 900% in 24 Hours – Altcoins Bitcoin News
September 13, 2021
On-chain data shows Bitcoin exchange reserves have hit the lowest value in 3 years, here’s what it might mean for BTC’s price.
Bitcoin Exchange Reserves Lowest In 3 Years As Negative Netflows Continue
As pointed out by a CryptoQuant post, exchange reserves have been continuing their downtrend, and have now reached lows not seen since 3 years ago.
The all exchanges reserve is an indicator that shows the total amount of Bitcoin held in wallets of all centralized exchanges.
An increase in the metric’s value suggests more investors are depositing their coins for withdrawing to fiat or altcoin purchasing. On the other hand, a decrease means more buyers are moving their BTC to personal wallets for hodling or OTC deals.
Here is the latest chart for the Bitcoin all exchanges reserve:
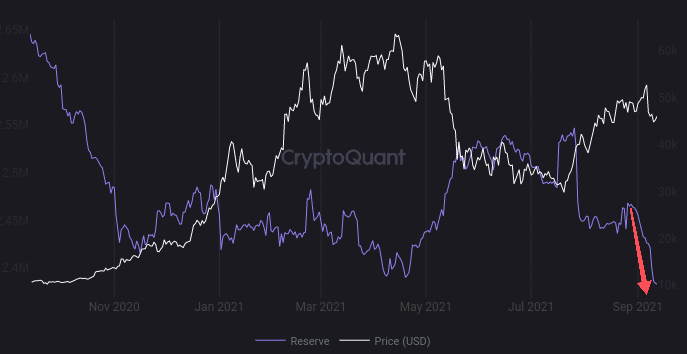
The BTC all exchanges reserve plunges down
As the above graph shows, the value of the indicator has sharply gone down recently. The current level of the metric is the lowest it has been in the last three years.
As already mentioned before, a downtrend like this one means investors are withdrawing their coins from exchanges possibly to hodl or sell through OTC deals.
Related Reading | Indicators Show Bitcoin Might Be Gearing Up For One Last Push Up
Such values are typically bullish in the long-term as they may mean that there are more long-term holders in the market who are hodling out of exchanges.
There is another relevant indicator here, called the Bitcoin netflow, which shows the net amount of BTC entering or exiting exchanges.
A positive spike in the chart for the exchange netflows means exchanges are observing more inflows compared to the outflows. A negative value implies just the opposite.
Big spikes or a prolonged period of smaller spikes in one direction can affect the value of the exchange reserves. Naturally, positive values can increase the reserve while negative ones can decrease it.
Related Reading | Ukraine Adopts New Law To Legalize Bitcoin And Other Cryptocurrencies
The below chart shows the current trend for the exchange netflows:
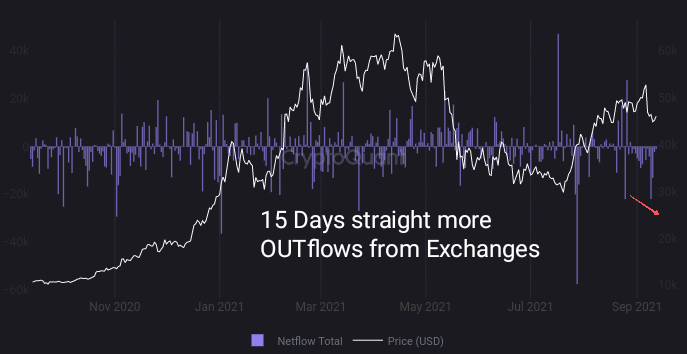
The BTC netflows show big negative spikes
As expected, the netflows have been negative recently, leading to the low values of the Bitcoin exchange reserves.
What Could It Mean for BTC’s Price?
As mentioned earlier, a downtrend in the exchange reserves can be bullish for the price in the long-term as it may imply a greater amount of long-term holdings. This has also been usually true historically, but there can be certain exceptions.
However, looking at the current Bitcoin price movement, it looks like selling has been going on. But as the exchange reserves haven’t shot up (unlike the crash from the May ATH), sales are being done likely through OTC deals.
Now, depending on if most of the outflows are being done to sell through OTC deals, a bearish picture can be there instead.
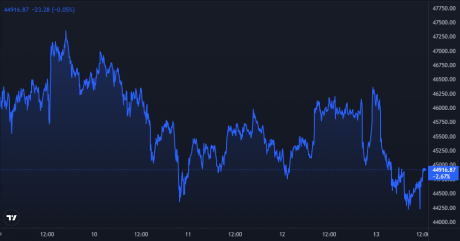
BTC's price continues to decline | Source: BTCUSD on TradingView
Featured image from Unsplash.com, charts from TradingView.com, CryptoQuant


