
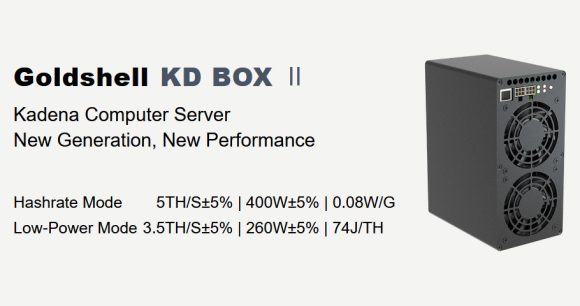
Goldshell KD BOX II Kadena (KDA) ASIC Miner Available Now
January 5, 2023
Huobi net outflows crossed over 60M within the past 24 hours: Report
January 6, 2023
On-chain data shows the Bitcoin exchange depositing transactions are now at a 4-year low, indicating that the bottom may be here.
Bitcoin 30-Day MA Exchange Depositing Transactions Have Declined
As pointed out by an analyst in a CryptoQuant post, the metric’s current levels are the same as in Q1 2019. The “exchange depositing transactions” is an indicator that measures the total number of Bitcoin transfers that are headed toward centralized exchanges.
The difference between this metric and the more popular exchange inflow is that the latter indicator tells us the total amount of BTC being deposited to exchanges, that is, the combined sum of the value of each transaction going to exchanges (rather than their total number), which is a value that can be inflated by a few whales and are thus not representative of the trend being followed by the entire market (especially the retail investors).
But since the exchange depositing transactions only focus on the pure number of individual transfers taking place rather than their amounts, the metric could give a more accurate picture regarding whether the average investor is sending coins to exchanges or not at the moment.
Since one of the main reasons holders deposit to exchanges is for selling purposes, a high value of this indicator can have bearish implications for the price of the crypto. On the other hand, low values imply not many investors are applying selling pressure right now.
The below chart shows the trend in the 30-day moving average (MA) Bitcoin exchange depositing transactions over the last several years:
The 30-day MA value of the metric seems to have been pretty low in recent days | Source: CryptoQuant
As shown in the graph, the 30-day MA Bitcoin exchange depositing transactions have declined for quite a while and have recently hit pretty low values. The current levels are the lowest the indicator has observed since Q1 2019, four years ago.
Back then, the bear market of that cycle was at its final stages as the asset price was at cyclical lows. This means that the appetite for depositing coins to exchanges, and thus for selling BTC, is at historically low levels.
This could suggest that the selling pressure may have become exhausted in the market now, and the bottom could be near, if not already, for the current BTC cycle. However, the quant in the post also notes that the bottoming process being possibly here doesn’t discount the possibility that there could still be a final downward push left for Bitcoin.
BTC Price
At the time of writing, Bitcoin is trading around $16,700, up 1% in the last week.
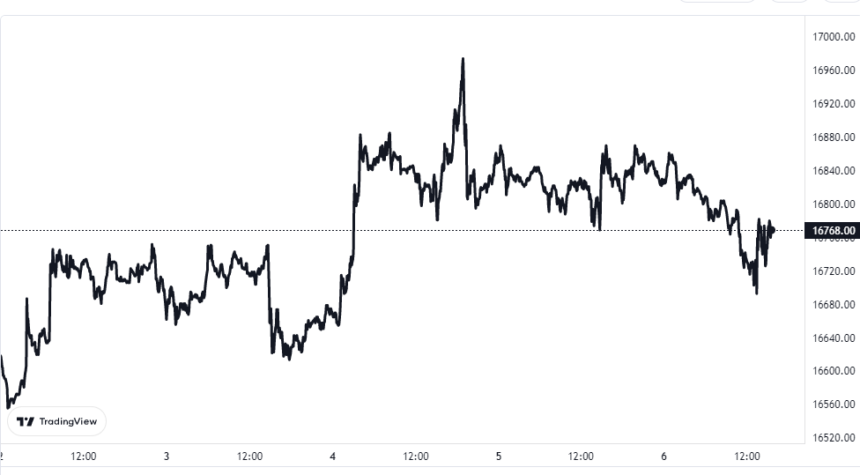
Looks like the value of the crypto has been consolidating sideways in the last few days | Source: BTCUSD on TradingView
Featured image from Thought Catalog on Unsplash.com, charts from TradingView.com, CryptoQuant.com


