

Do Kwon Challenges SEC’s Jurisdiction in Multibillion-Dollar Crypto Securities Fraud Case – Bitcoin News
April 22, 2023
Janice McAfee Continues Battle for Release of John McAfee’s Remains, 670 Days After His Death – Bitcoin News
April 23, 2023
Over the last few days, Avalanche has experienced significant losses, plunging by almost 20%. On a weekly timeframe, AVAX has lost 10% of its market value. Although the daily timeframe indicates that AVAX has made a slight upward movement on its chart, with an appreciation of 1.6%, the technical outlook for Avalanche remains bearish.
Buyers have been cautious about price movements while sellers have dominated the market, leading to a decrease in both demand and accumulation on the daily chart. In order for the Avalanche price to experience some relief, it needs to break above the $18 mark.
However, the $17 price level has acted as a supply zone for the altcoin. If bulls cannot defend the current price mark of the altcoin, the bears may take full control of the asset’s price.
Similar to other prominent altcoins, major market movers have been struggling to break their crucial resistance levels. The decline in AVAX’s market capitalization indicates a decrease in buying pressure in the market.
Avalanche Price Analysis: One-Day Chart
At the time of writing, AVAX was priced at $17.17. The immediate resistance for the altcoin was at $18, and if breached, could lead to a push towards $19, thereby strengthening the bulls.
However, if Avalanche continued to trade sideways, a fall below the $17 level was expected. In such a case, the next support level for the asset was $15.
The altcoin’s recovery was dependent on buyers stepping in to push its price above the $18 mark. The recent amount of AVAX traded was red, which suggested an increase in selling pressure in the market.
Technical Analysis
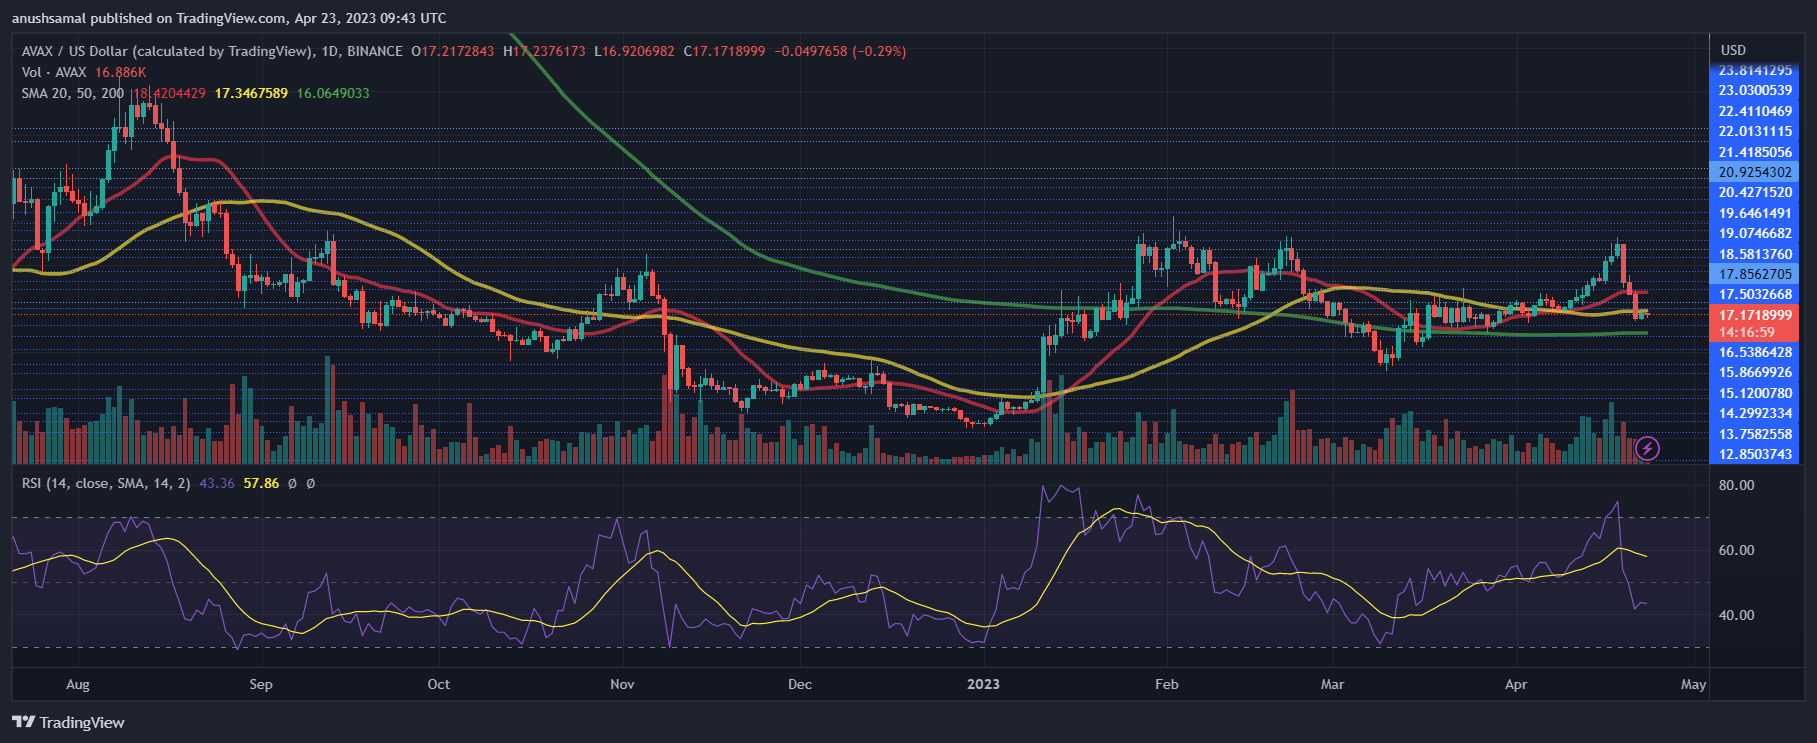
Over the past week, there has been a significant drop in demand for the altcoin, leading to a decline in its value. Despite efforts by bullish investors to regain buying strength, it is essential to surpass immediate resistance to make progress.
The Relative Strength Index indicates that sellers outnumber buyers, with the index below the 50-mark. Though there has been a minor upswing, the bearish influence continues to dominate.
Additionally, the AVAX price remains below the 20-Simple Moving Average, indicating that sellers are gaining momentum and steering the market’s price action.
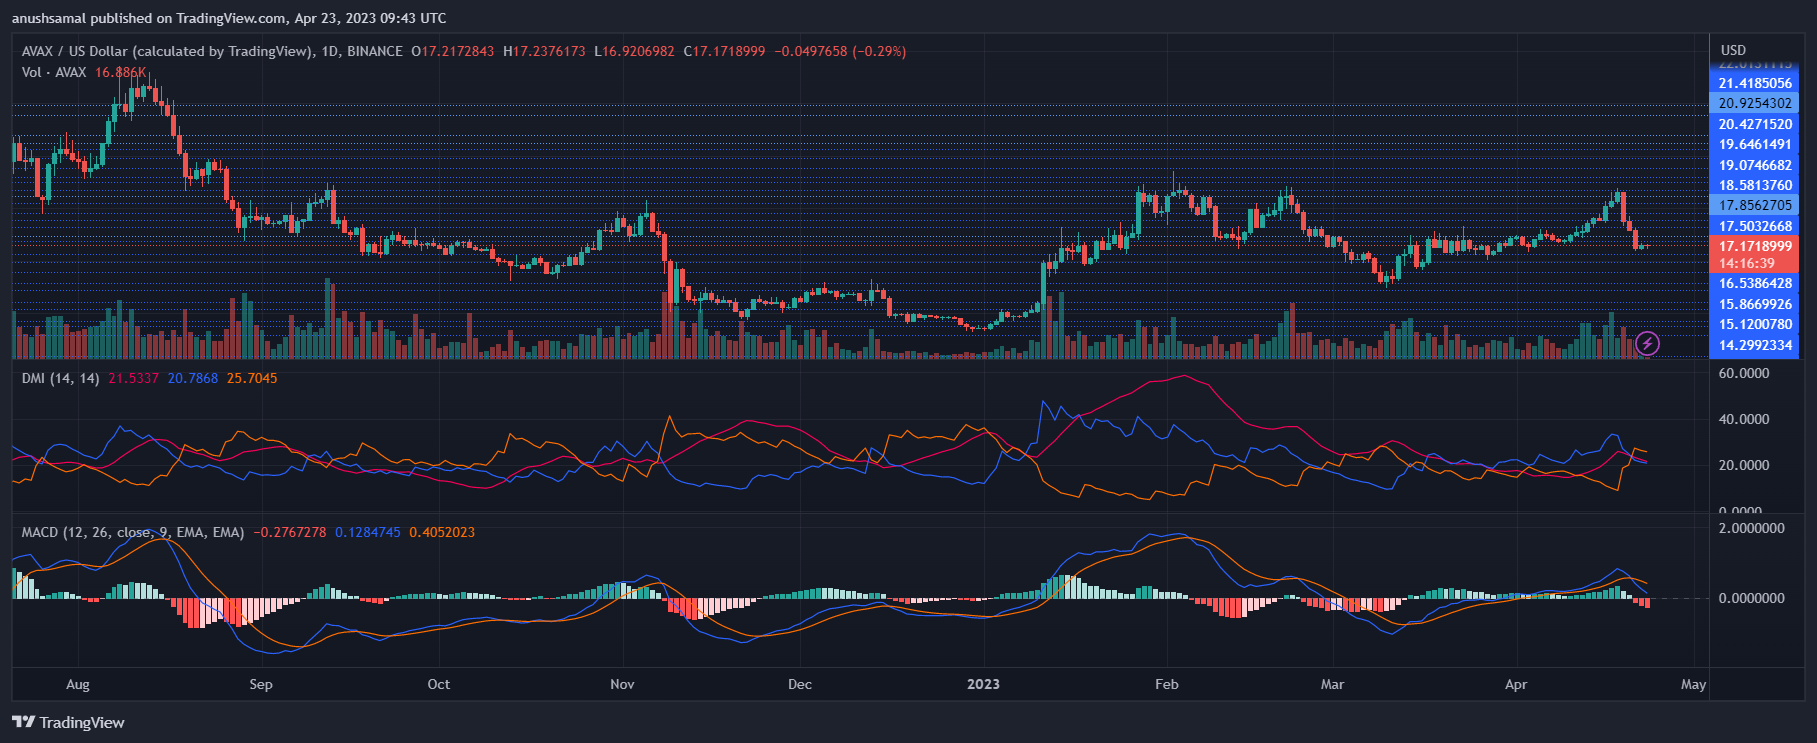
In addition, further technical indicators suggest that bearish momentum is prevailing. The Moving Average Convergence Divergence indicator shows the price momentum and reversals in the market. On the one-day chart, red histograms have formed, indicating sell signals.
The Directional Movement Index determines the price direction, and currently, the -DI line (orange) is above the +DI line (blue), resulting in a negative DMI reading. The Average Directional Index (red) is above the 20-mark, indicating that the price momentum is gaining strength.
Featured Image From UnSplash, Charts From TradingView.com


