

XRP Hits Critical Level – Should Traders Brace For Impact?
November 6, 2023
9 tips for a food business considering blockchain for its supply chain
November 7, 2023
Bitcoin could see a decline of at least 20% in the near future, if the historical pattern of this indicator is anything to go by.
Aggregated Open Interest Of Assets Except Bitcoin Is Forming A Bearish Pattern
In a new post on X, CryptoQuant Netherlands community manager Maartunn has talked about a bearish pattern forming in the aggregated open interest of all cryptocurrencies except Bitcoin.
The “open interest” here refers to an indicator that measures the total amount of derivative positions (in USD) that are open on all exchanges around the world right now.
When the value of this metric is high for any cryptocurrency, it means that the asset has a high number of positions on the derivative market currently. Generally, this kind of trend makes it more probable for the price to show volatile moves.
On the other hand, low values imply the derivative side of the coin in question is cool at the moment, which may suggest a relative period of calmness for the price.
In the context of the current discussion, the aggregated open interest of all cryptocurrencies excluding Bitcoin is of interest. The below chart shows the trend in this indicator over the past couple of years:
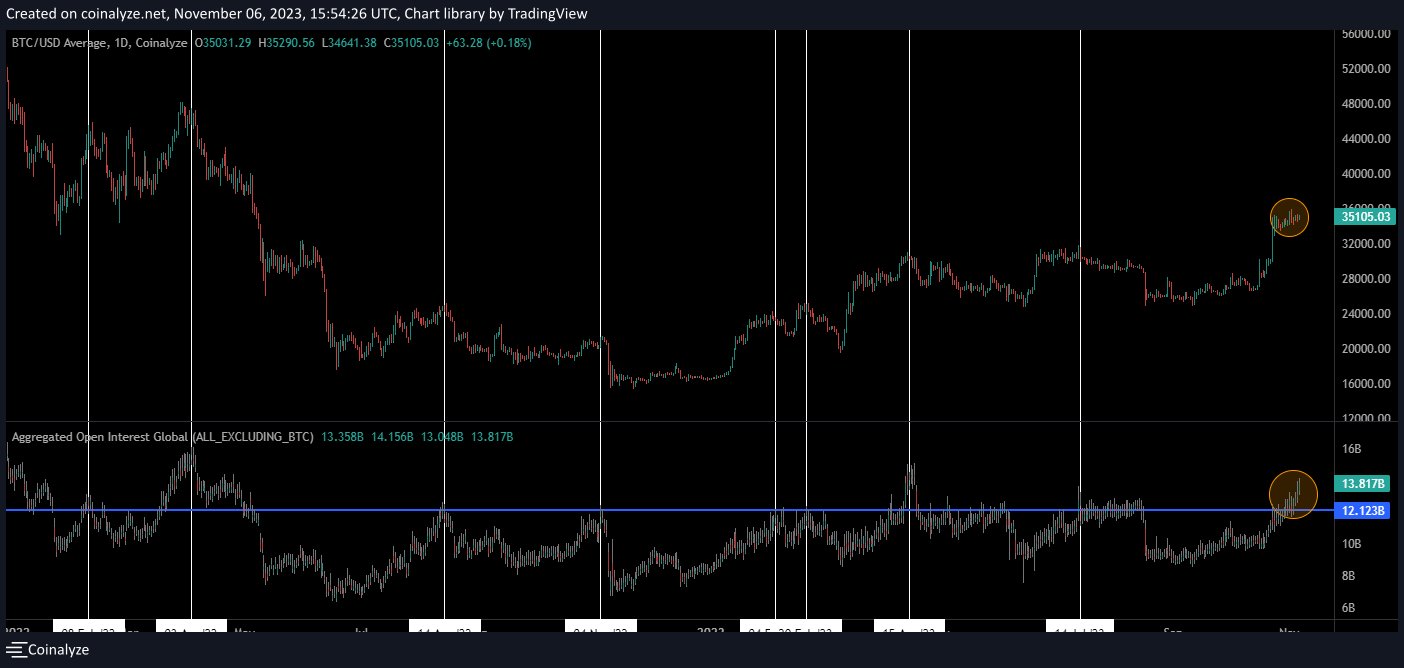
Looks like the value of the metric has been rising in recent days | Source: @JA_Maartun on X
In the graph, Maartunn has highlighted an interesting pattern that the aggregated open interest of the altcoins and the Bitcoin price has followed in the last two years.
It would appear that whenever the indicator’s value has crossed the $12.2 billion mark, the BTC price has observed a top formation and has subsequently registered a decline. According to the analyst, this drawdown that has followed the pattern has always been at least 20%.
Just this year, the tops of the cryptocurrency’s price observed in February, April, and July all occurred during periods where the metric was above the $12.2 billion level.
From the chart, it’s visible that the aggregated open interest of the sector excluding BTC once again crossed above this line of historical significance back when the asset’s rally toward the current levels first happened.
Since then, the metric has only continued to climb higher and has now hit the $13.8 billion mark, meaning that the derivative market has become quite overheated now.
If the pattern that Bitcoin has displayed in the past is anything to refer to, then the asset may be fast approaching the top right now, given the overheated altcoin open interest.
As another analyst has pointed out on X, the dominance of the futures open interest made up for by assets other than Bitcoin and Ethereum has also hit 2023 highs.
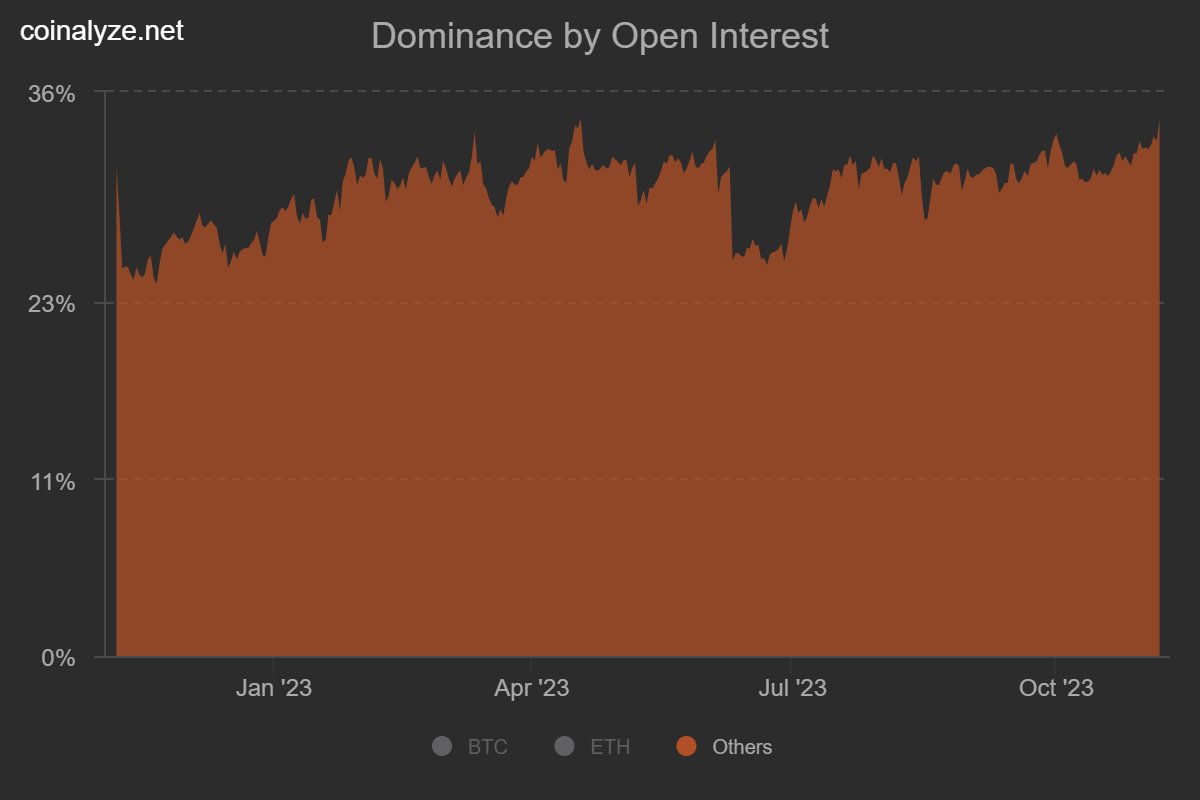
The metric's value appears to have gone up in the last few days | Source: @WClementelll
This once again puts into perspective the overheated status of the market, which could end dangerously for Bitcoin as well as the rest of the cryptocurrency sector.
BTC Price
Bitcoin had made another go at $35,000 in the last two days, but the asset has now once again slipped below the level as it’s now trading around $34,700.
BTC has plunged during the past day | Source: BTCUSD on TradingView
Featured image from Shutterstock.com, charts from TradingView.com, Coinalyze.net


